ar
ar
- Copper carries the informal title “Dr. Copper” because its price tends to move in line with global industrial output, often before economic data confirms the shift.
- China accounts for approximately 55% of global copper consumption, making copper readings one of the most direct proxies for Chinese industrial health.
- Traders watch the copper-gold ratio as a refined market signal.
Copper is everywhere. It runs through construction sites, electrical grids, factories, appliances, data centres and electric vehicles.
Because it sits at the heart of so many industrial processes, copper demand often rises when the economy is expanding and weakens when growth begins to slow.
That is why traders often call it “Dr. Copper,” the metal with a reputation for diagnosing the health of the global economy before official data catches up.
When copper prices climb, markets may read it as a sign of stronger demand, infrastructure spending or manufacturing activity. When prices fall, it can suggest softer growth, weaker industrial output or lower confidence in the economic outlook.
In that sense, copper is one of the market’s most closely watched economic signals out there.
How Copper Signals Expansion
Rising copper prices typically indicate that construction activity is accelerating, factories are increasing output, and energy infrastructure investment is expanding. Each of those activities requires copper in volume.
The chain does not stop at copper. Rising prices tend to coincide with improving equity market sentiment, particularly in industrial and materials sectors, as investors price in higher earnings expectations for companies tied to physical production.
Global PMI data and copper signals have historically moved together in strong growth cycles, as both reflect the same underlying variable, the pace of industrial activity.
The Copper-Gold Ratio
The ratio between copper and gold prices is one of the most closely watched signals among macro traders.
Gold responds to uncertainty. It often rises when investors seek safety and can pull back just as quickly when confidence returns.
Copper has historically moved in the opposite direction under the same conditions. When the ratio rises, with copper outperforming gold, markets might read that as a growth-positive signal.

When safe-haven demand for gold exceeds copper demand, the ratio contracts, and the signal turns cautionary.
The ratio also correlates with government bond yields. A rising copper-gold ratio has historically coincided with rising long-term Treasury yields, reflecting the expectation that stronger growth will produce higher inflation and tighter monetary policy.
However, the relationship can weaken when inflation, central bank policy or supply shocks dominate the headlines.
When the Signal Breaks Down
Copper’s signal is not infallible. Supply-side disruptions, including mine strikes, export restrictions, or tariff-driven demand distortions, can push prices in ways that do not reflect underlying economic conditions.
US tariff uncertainty in early 2026 created exactly this dynamic. Copper prices moved on speculation about trade flows rather than on underlying demand signals.
In those environments, the copper indicator is most useful when confirmed by adjacent data such as PMI readings, freight volumes, and manufacturing orders.
A Falling Copper Price Tells a Different Story
When copper falls sharply, the implications extend well beyond mining companies.
During the 2015 China slowdown, copper dropped approximately 57% from its 2011 peak ⁽²⁾ as Chinese construction and manufacturing activity contracted.
Commodity-exporting emerging market currencies fell sharply alongside it. Zambia’s currency lost more than 17% in a single trading session, with copper accounting for approximately 85% of the country’s exports ⁽²⁾.
GCC economies face a version of this dynamic through oil. When copper signals a slowdown in Chinese industrial demand, oil demand projections typically adjust downward in parallel, compressing fiscal revenues for Gulf exporters.
Earlier in May, three-month copper futures on the London Metal Exchange traded above $14,000 per ton at its peak ⁽³⁾, a level consistent with strong industrial demand signals from China.
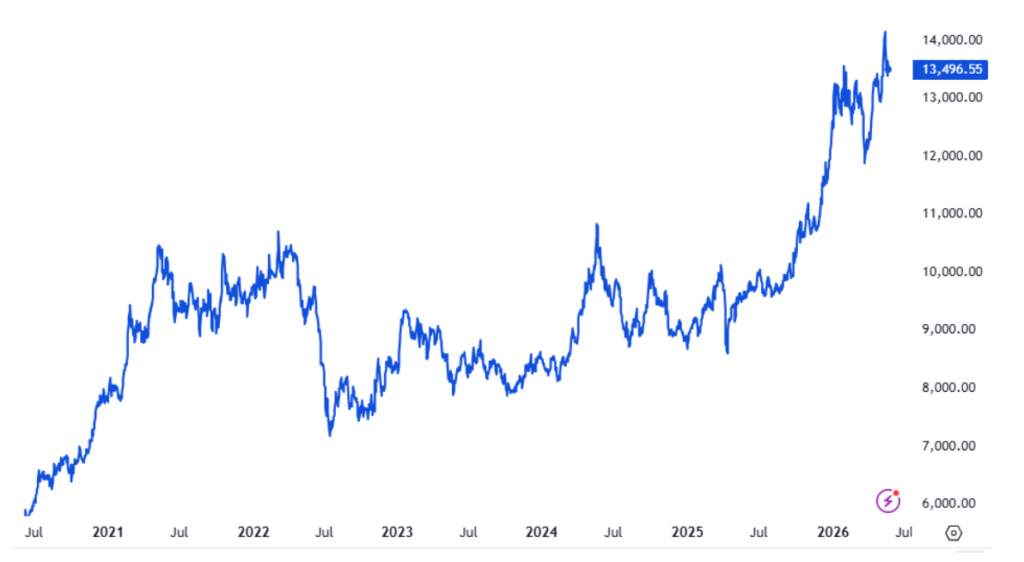
J.P. Morgan projects a refined-copper deficit of around 330,000 metric tons in 2026 ⁽⁴⁾, which could sustain copper’s current growth-positive reading if confirmed.
Final Thoughts
Copper earns the “Dr. Copper” title because it turns real economic activity into a continuously traded market signal.
It is used across construction, manufacturing, power grids, data centres and electric vehicles, so changes in copper demand can reveal shifts in industrial momentum often before official data confirms them.
But copper is not a perfect forecast. Supply disruptions, tariffs, stockpiling and speculative flows can all distort the signal. That is why traders usually read copper alongside PMI data, manufacturing orders, freight activity and the copper-gold ratio.
Used carefully, copper does not tell the whole economic story. But it can offer one of the market’s earliest clues about where growth expectations may be heading.