ar
ar
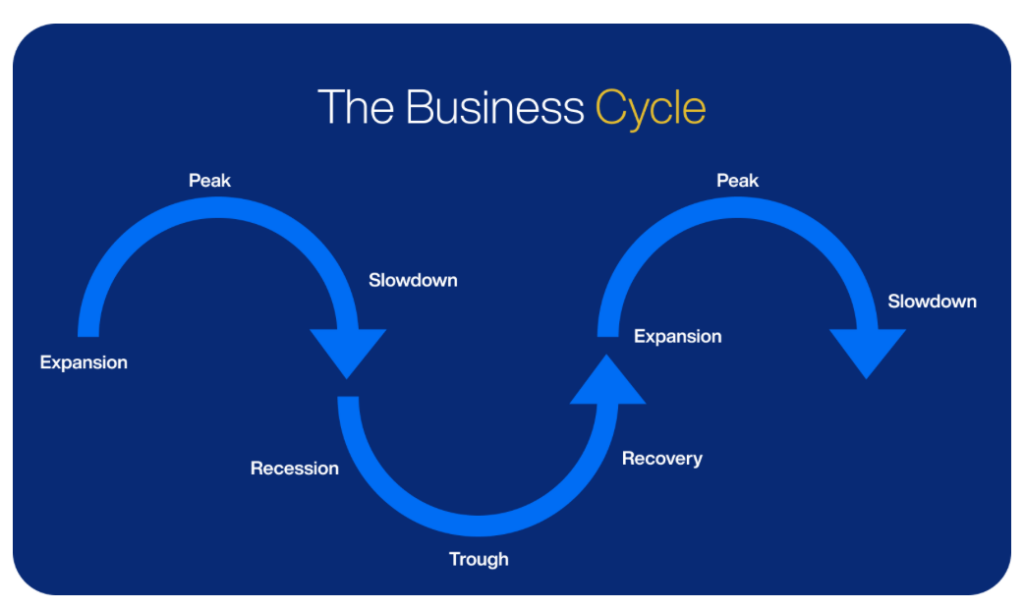
- The economic cycle describes how growth, employment and prices move through four repeating phases of expansion, peak, contraction and trough.
- Different phases have historically rewarded different sectors, bond yields and credit spreads, which is why the cycle shapes how capital gets positioned across markets, not just how growth gets forecast.
- Geopolitical shocks, from the 1973 oil embargo to more recent supply disruptions, can override the cycle’s normal pace entirely.
Every economy moves through recurring periods of growth and slowdown. Economists call this pattern the economic cycle, sometimes the business cycle.
Knowing where the cycle stands does not reveal what happens next. It reveals which forces are currently dominant, and why markets are pricing risk the way they are.
How the Economic Cycle Moves Through Its Phases
The cycle runs through four phases. During expansion, output, employment and spending rise together as credit flows easily and confidence builds. A peak marks the point where growth stops accelerating. ⁽¹⁾
From there the economy contracts: output shrinks, hiring slows, and the trough marks the low point before the next expansion begins. NBER data since 1945 shows expansions have averaged just over five years, contractions typically under one. ⁽²⁾
Why the Cycle Matters for Investors
Different phases have historically rewarded different parts of the market, and reshaped how risk gets priced across asset classes.
Early in a recovery, financials, industrials and consumer discretionary companies have tended to lead, as credit conditions ease and spending picks up.
As growth matures, technology often takes the lead, before energy gains ground as inflation pressures build, and defensive sectors like utilities and staples have historically held up well once contraction sets in. ⁽³⁾
The same rotation shows up in bonds and credit.
Government yields typically fall as central banks cut rates to support a slowdown. For example, the 10-year US Treasury yield fell from roughly 4% in mid-2008 to around 2% by December. Corporate credit spreads move the same way, more than doubling to 877 basis points in March 2020 as the pandemic hit cash flows almost overnight. ⁽⁴⁾
None of this runs on a fixed schedule. What it shows is that cycle position changes how the same data point gets read. A soft jobs report late in an expansion can signal room for a central bank to ease, supporting risk assets, while the same report during a slowdown reads as confirmation that conditions are deteriorating.
For GCC-based investors, the cycle carries one more layer. Global growth phases feed directly into oil demand, which shapes fiscal revenue for Gulf exporters and, in turn, regional equity and currency markets.
When Geopolitical Shocks Override the Cycle
In October 1973, an Arab oil embargo cut supply and pushed prices from around $3 a barrel to nearly $12 within months, showing that geopolitical shocks do not wait for the cycle’s normal rhythm to play out. US unemployment climbed from 4.6% to 9% over the next two years while inflation stayed elevated, a pairing now cited as the defining case of “stagflation.” ⁽⁵⁾
The embargo hit supply directly, so the economy absorbed a growth shock and a price shock at once.
Later disruptions, including the 1979 Iranian revolution and the 1990 Gulf War, followed the same pattern. Supply was constrained, and the cycle’s next phase arrived faster than domestic data alone would have suggested.
The Cycle Can Also Run Longer Than Expected
One thing to note about that cycles do not run on a fixed timer. The US expansion that began in June 2009 lasted 128 months before ending in February 2020, the longest on record.
The current expansion shows how mixed the signals can get. Real GDP grew at an annualized 2.1% in the first quarter of 2026, yet US employers added just 57,000 jobs in June, well below forecasts, even as unemployment held at 4.2%. ⁽⁶⁾
Growth and hiring pointing in different directions is exactly what makes timing a turn difficult in real time.
Sources: ⁽¹⁾ National Bureau of Economic Research, ⁽²⁾ ⁽³⁾ Fidelity Investments, ⁽⁴⁾ Federal Reserve Bank of St. Louis (FRED), ⁽⁵⁾ Federal Reserve History, ⁽⁶⁾ U.S. Bureau of Economic Analysis