ar
ar
In global energy markets, two oil benchmarks dominate price setting and trading activity, which are Brent Crude and West Texas Intermediate.
These two oil benchmarks act as reference prices for crude oil transactions globally and play a major role in energy markets, inflation, and the fiscal stability of economies that are major producers and exporters of oil.
However, both benchmarks have their differences in oil streams and trade in different markets, but their prices move together. This correlation indicates the integrated nature of global oil markets.
Key Differences between Brent and WTI
While Brent and WTI are closely correlated, they are actually different in a lot of ways.
Geographic Benchmark
Brent is considered the global oil benchmark, pricing a large part of global trade in oil, especially in shipments between Europe, Asia and the Middle East. WTI, however, is the primary benchmark for the US, as it shows supply and demand conditions in the North American region.
Delivery Locations
Brent is extracted from oil fields and platforms in the North Sea and is linked to seaborne crude markets, which means that oil is transported globally by sea using tankers instead of pipelines.
WTI is delivered to Cushing, Oklahoma US, which is a major inland storage and pipeline hub. Because the storage is located inland and not connected directly to the sea, oil must be transported through pipelines or by rail. If too much oil is produced and arrives with fewer pipelines to transport it, it can build storage, massively impacting the price of WTI.
Pricing Relationship and Quality
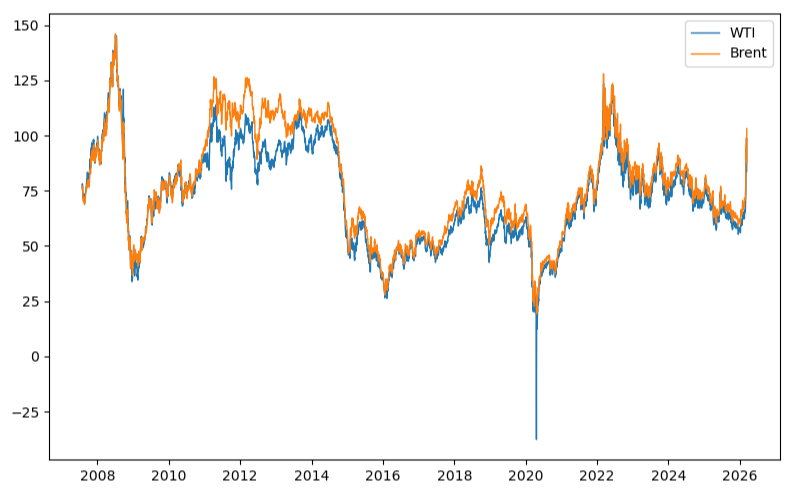
Because of these differences, Brent and WTI are priced differently, with Brent usually trading above WTI by a range of $2-$8. But this can sometimes widen due to major market imbalances like supply disruptions.
There was a time when WTI was higher than Brent during the 2000s. Around 2010-2011, the US shale boom increased production levels for the United States in a major way, with most of that oil flowing into Cushing, Oklahoma, leading to storage bottlenecks because there weren’t many pipelines connected to the coast. The price differences are driven by logistics and market structure.
? Did you know?
The US shale boom turned the United States from one of the world’s largest oil importers into a leading producer, adding over 8 million barrels per day of output between 2008 and 2019, one of the fastest supply expansions in energy history.
For their quality, both Brent and WTI are known as light, sweet crude oil, meaning that they have low levels of sulfur and are easier to refine into petroleum products such as gasoline and diesel. WTI has slightly less sulfur and is lighter than Brent, but it isn’t a major thing.
Balanced Pricing Ranges
Oil prices have major impacts on both producers and consumers in the global economy. Usually, Brent trades around $65-$85 per barrel while WTI trades between $60-$75. Now, someone would ask, why are these price ranges considered good or as ‘Goldilocks’?
Due to these ranges, energy companies can stay profitable and continue their investments in exploration and production while avoiding high inflation as energy costs remain manageable for businesses and consumers.
Oil prices also impact the policy decisions of OPEC and its partners.
Many countries that export oil rely heavily on oil revenue to fund government spending and economic plans. A price range of $70-$80 per barrel allows OPEC economies to maintain fiscal stability without changing production levels.
? Definition
OPEC is a group of major oil-producing countries that work together to control oil supply and influence global oil prices.
When oil prices fall significantly below this range, OPEC and its allies often respond with coordinated production cuts to tighten supply and support the market. On the other hand, extremely high prices can weaken global demand and encourage competing supply from producers such as US shale companies.
These ranges have been identified as a stable, long-term equilibrium following post-pandemic recovery, balancing market surpluses with demand.
The Impacts of High and Low Oil Prices on the Global Economy
Oil prices strongly impact inflation, transportation costs, and economic growth.
When Oil Prices Rise Above Their Ranges
When prices surge above their respective ranges, let’s say toward $90-$100 per barrel or higher, fuel costs rise sharply, leading to higher transportation and production costs, which in turn creates higher inflation. They also cause a reduction in consumer spending and raise operating costs for businesses. In this type of scenario, central banks usually hike interest rates to control inflation.
During the height of the Ukraine-Russia war, oil prices rose significantly, with Brent reaching $130 per barrel, reaching early 2010s highs. This occurred following the Russian invasion of Ukraine, where markets feared major supply disruptions to Russian oil exports, alongside sanctions on Russia and a massive demand surge after the COVID recovery.
A similar story is happening now in the Middle East. The current conflict is disrupting supply, with oil tankers taking heavy damage in the Strait of Hormuz due to a blockade, sending oil prices up to $100.
When Oil Prices Go Down Below Their Ranges
However, what goes up must come down. If oil prices fall below their respective ranges, another set of problems emerge for oil producers.
Falling oil prices lead to less investment in energy production, and therefore, potentially less drilling activity and cuts to capital spending. While lower fuel prices may benefit consumers in the short term, prolonged periods of low prices can reduce future supply growth and create volatility in energy markets.
In 1999, crude oil went from $10 to nearly $100 by 2007, driven by strong global demand, especially from China, and limited supply growth.
Despite rising recession risks, prices peaked at $147 in mid-2008 before collapsing nearly 80% to $30 by year-end. The Global Financial Crisis crushed growth, trade and demand, while the collapse of Lehman Brothers triggered panic and forced liquidation of speculative positions, accelerating the decline in oil prices.
A similar crash happened in 2020, but this time, oil prices didn’t just drop, they went negative.
The oil crash of 2020 was driven by a sudden collapse in demand during COVID lockdowns, which halted travel and slowed economic activity.
At the same time, supply surged after a breakdown in OPEC+ cooperation triggered a price war, with Saudi Arabia increasing output and offering discounts.
This created a huge supply-demand imbalance, overwhelming storage capacity, especially in the US, leading WTI prices to briefly turn negative at -$37. Unlike 2008, this was a physical market collapse caused by excess supply and collapsing demand.
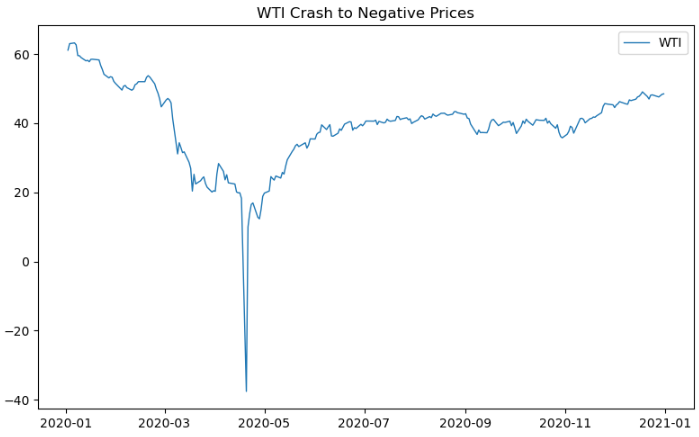

The chart above shows the major price movements of Brent crude during major financial market events since 2008.
Cointegration and Spread Between Brent and WTI
Despite their structural differences, Brent and WTI prices tend to move together over time. This reflects the highly integrated nature of global oil markets, where arbitrage and trade flows help keep prices aligned.
This relationship can be described using cointegration, which means that while both prices may trend over time, the difference between them remains relatively stable in the long run.
In simple terms, short-term shocks such as geopolitical events, inventory changes, or transportation disruptions can cause temporary divergences between Brent and WTI. However, these differences do not persist indefinitely, as market forces tend to bring prices back toward a more balanced relationship.
The spread chart illustrates this behavior from 2021 to the present. The spread moves higher and lower over time rather than trending in one direction, highlighting how the relationship between the two benchmarks adjusts as market conditions change.
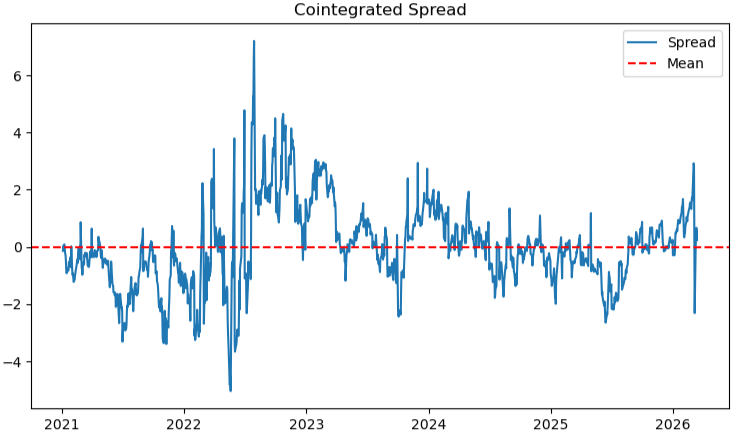
Overall, this suggests that while Brent and WTI may diverge in the short term, their prices remain linked over the longer term.
Forecasts From Major Institutions
As we know, the current conflict in the Middle East has driven oil prices up to $100 per barrel and threatened further supply disruptions to shipments going out of the Strait of Hormuz, where 20% of the world’s oil passes through.
Based on current forecasts, Goldman Sachs expects Brent to average $98 per barrel in March and April before falling to $71 by the fourth quarter of the year. In an upside risk scenario, if flows through the strait remain disrupted for a month, prices are expected to rise from the average forecast of $98 to $110 before gradually declining to $76 in the fourth quarter. ⁽¹⁾
Spot prices could exceed their 2008 peak of $147 if flows remain depressed through March, the analysts said. ⁽²⁾
Citi also raised its crude oil forecasts for Brent to $75 per barrel for the first quarter, $78 for the second, and $68 for the third, as opposed to $73, $70 and $62 earlier. ⁽³⁾
Bank of America’s commodity research team said in a note that its updated view reflects two equally likely paths: a quick resolution that restores flows by April and puts Brent near $70, or a longer disruption spilling into the second quarter that keeps prices elevated. ⁽⁴⁾
Bank of America also said nearly 200 million barrels of crude have already been cut off from the market, tightening inventories far faster than expected.
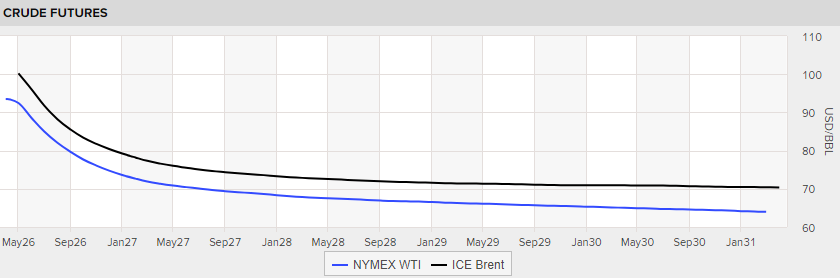
The curve above shows a market-implied forecast derived from oil futures, showing where traders are currently willing to buy and sell oil in the future. It indicates expectations around supply, demand and macro factors based on real market positioning.
However, it’s not a prediction of future spot prices as futures include risk premiums and can shift with new information. In practice, it’s best described as a pricing path, suggesting oil may gradually ease toward the $65–$85 range over the longer term.
Futures Curve Structure: Contango vs Backwardation
Another important concept in oil markets is the structure of the futures curve, which can appear either in contango or backwardation.
In a contango market, futures prices are higher than the current spot price. This often occurs when supply is abundant and storage levels are high. Traders may buy physical oil, store it, and sell futures contracts at a higher price, locking in the spread.
In a backwardation market, the opposite occurs. Spot prices trade above futures prices, typically reflecting tighter supply conditions or strong immediate demand. Backwardation often signals that the market is drawing down inventories.
Oil markets frequently move between contango and backwardation depending on supply-demand dynamics, storage capacity, and geopolitical developments.
During periods of oversupply, such as the 2020 pandemic crash, the oil market moved sharply into contango as storage facilities filled rapidly. In contrast, during supply disruptions or strong demand cycles, the market often shifts into backwardation.
Understanding this curve structure helps traders interpret inventory trends, supply pressures, and market expectations.
The Broader Takeaway
The relationship between Brent and WTI highlights a core feature of oil markets, that alignment is structural, but divergence is cyclical.
- In balanced conditions, the spread remains stable.
- In regional disruptions, WTI can diverge due to logistics and inventories.
- In geopolitical shocks, Brent tends to reflect global risk premiums more quickly.
Over time, arbitrage and trade flows bring both benchmarks back toward equilibrium.
The Brent–WTI spread therefore acts as a reflection of underlying market conditions rather than a fixed relationship.