ar
ar
In financial markets, there are some assets that can move together, driven by major changes in the macroeconomic picture.
In this article, we look at the correlation between gold, stocks and government bonds. The relationship between these three can help market participants understand risk sentiment, expectations in economic data (especially inflation), and changes in monetary policy.
Using exchange-traded funds allows the analysis to capture real-world cross-asset interaction, reflecting how diversified portfolios responded to shifting macro conditions.
Asset Breakdown
In this article, the assets used include the ETFs listed below:
- SPY: tracks the SPDR S&P 500 ETF Trust
- GLD: tracks SPDR gold stocks, mainly following gold.
- TLT: tracks iShares 20+ Year Treasury Bond ETF
The reason ETFs are used here instead of derived assets is that the correlation between these three ETFs shows how capital rotates between risk, safety and inflation hedges.
Because they are highly liquid, market-priced, and tradeable instruments, they reflect real investable flows, capture actual investor positioning, and make correlation actionable rather than theoretical.
Correlation Breakdown
Gold vs S&P 500: Risk-On and Risk-Off Sentiments
When trouble comes in the markets, gold is viewed as a safe-haven asset, while the S&P 500 represents 500 US companies that usually appreciate during risk-on times. The relationship between these two assets have their differences.
- Negative Correlation (Risk-Off)
During times of financial stress, such as recessions, geopolitical tensions, or other types of crises that affect markets, investors usually rotate out of stocks and shift into safe-haven assets, mainly gold, due to its strong safe-haven appeal.
- Positive Correlation (Risk-On)
Usually, when central banks are dovish and inject liquidity into the economy, both gold and stocks appreciate together. This usually occurs during monetary easing cycles, especially aggressive ones, which we saw over the past two years. This factor also causes bond yields to decline, supporting the rise of gold and stocks.
Interest rates are also key drivers. When real yields fall, gold becomes more attractive relative to yield-bearing assets, often strengthening even if stocks are also rising.
Gold and US Treasuries: The Real Yield Channel
Gold is a non-yielding asset, which doesn’t generate income periodically, so its opportunity cost depends on Treasury yields.
When Treasury yields rise, gold declines as investors look to earn better returns from bonds, and vice versa.
However, during crises, both Treasuries and gold can rally together. In such cases, capital flows into safe-haven assets broadly, sometimes creating a positive short-term correlation.
S&P 500 vs Treasuries: Growth Expectations Matter
The correlation between equities and Treasuries shifts depending on whether markets are focused on growth or inflation.
- Growth Shock
If economic data weakens, stocks may fall while bond prices rise (yields drop). This creates a negative correlation.
- Inflation Shock
If inflation surges, both stocks and bonds can fall together because higher rates hurt equity valuations and bond prices simultaneously. This environment weakens diversification benefits.
Correlation is Not Always Static
Correlations are dynamic, but they change over time. During times of low inflation, stocks and bonds often move inversely, enhancing diversification.
However, during periods of high inflation, both assets have historically declined. Gold tends to outperform when real yields fall or when systemic risk rises.
For example, if markets are pricing aggressive rate cuts, but inflation remains sticky, the traditional stock-bond negative correlation may weaken. In that scenario, gold could serve as a more effective hedge than Treasuries.
Rolling Correlations Reveal Shifting Macro Regimes (2023–2026)
Data Source: LSEG
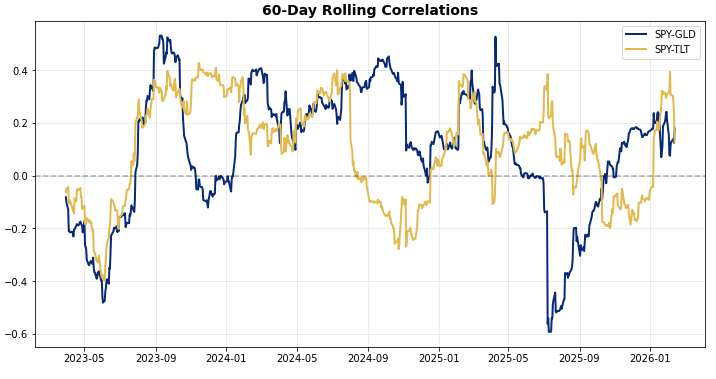
The 60-day rolling correlations between SPY, GLD and TLT show how cross-asset relationships are very dependent on policy and macroeconomic transitions, including things like political changes or fundamental structural changes in market rules, rather than stable relationships.
Instead of moving in fixed patterns, equities, gold, and Treasuries rotated leadership as the dominant macro narrative evolved from tightening to inflation shocks, to recession pricing, and eventually stabilization.
Before breaking down what happened in each timeline, let’s explain the 60-day rolling correlation.
A 60-day rolling correlation measures how two assets move together during the last 60 days. Despite using three years of data here, it doesn’t use all of it at once. The three-year timeframe gives enough data to keep calculating the 60-day relationship over time.
We use 60 days instead of all 3 years because markets change over time, and looking only at recent data gives a clearer picture of how the relationship looks right now.
Here’s a breakdown of each timeline:
Mid-2023: Growth Divergence Regime
Between May and July 2023, the SPY-TLT correlation turned negative as the Federal Reserve continued to hike rates despite strong economic data. The labor market was strong, alongside consumer spending. It was also the beginning of the AI-driven equity rally.
Yields were rising as markets repriced the terminal Fed rate higher, which pressured bond prices. However, equities continued advancing on growth optimism, which resulted in the negative correlation between the two assets. Inflation at the time was gradually declining after it surged to 9.1% YoY in 2022. It was a classic growth-versus-duration divergence, where economic strength lifted equities while rate sensitivity hurt bonds.
Late-2023: Rate Shock Regime
Between August and October 2023, the relationship between stocks and bonds became positive, as the 10-year Treasury yield reached 5%, hitting 2007 highs driven by the Fed’s “higher for longer” hawkish tone.
During this time, stocks and bonds came under pressure as yields spiked, as this phase reflects an inflation and policy uncertainty shock, where duration risk dominated across asset classes.
Gold at the time began its rise due to geopolitical tensions in the Middle East.
Early 2024: Policy Repricing
Correlations became more unstable in early 2024 as markets began to price future rate cuts before the Fed formally pivoted. Real yields softened, financial conditions eased, and risk appetite improved.
Treasuries rallied on rate cut expectations, stocks rose on improved sentiment, and gold surged on falling Treasury yields.
The SPY–TLT relationship oscillated but leaned negative during growth scares. This period reflects a liquidity-sensitive regime where expectations, rather than realized policy changes, drove asset prices.
Mid-2024: Sticky Inflation
Inflation remained persistent despite a gradual decline, which led to a scale-back in rate cut expectations, and correlations changed again. The relationship between stocks and bonds remained stable while the relationship between stocks and gold fell.
Late-2024: Fed’s 50 bps Rate Cut
In September 2024, the Fed delivered a 50 basis-point rate cut, the first one after an aggressive rate hike cycle that occurred in 2022 and 2023. Stocks moved higher as the markets anticipated a new easing cycle, gold pushed higher on a weak US dollar and falling yields, and bonds surged higher, with the yield curve steepening as the market priced more future cuts.
Early 2025: Uncertainty and Volatility Spike
When 2025 started, fear quietly entered the markets and correlations started to become more volatile, with SPY–GLD spiking sharply positive at times before reversing, while SPY–TLT fluctuated between positive and neutral territory.
When President Trump entered the Oval Office, his first plan was implementing tariffs. At first, markets didn’t acknowledge it, then they felt the pain later when Trump became more aggressive in his tone.
Since then, growth concerns have risen, the global trade outlook worsened, and inflation risks from tariffs have emerged. Because tariffs simultaneously threaten growth and elevate inflation pressures, correlations between equities, bonds, and gold became unstable, reflecting markets’ shifting interpretation of whether trade policy posed a demand shock or a pricing shock.
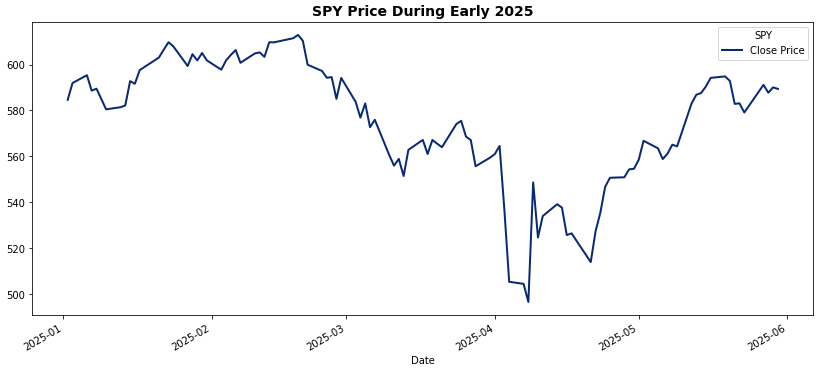
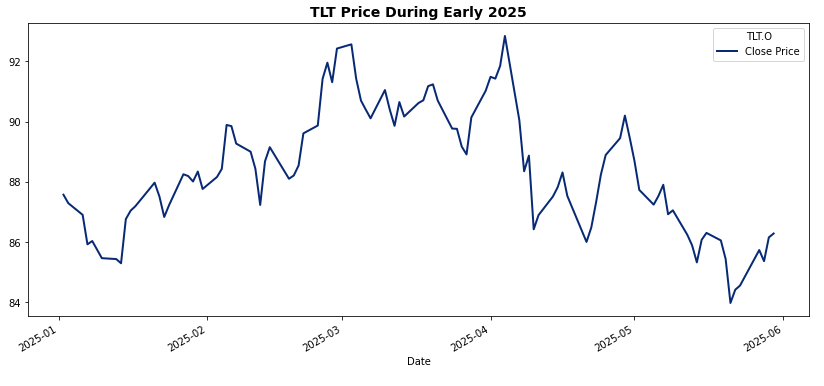
Back in April 2025, “Liberation Day” was announced on April 2, when Trump imposed tariffs on a long list of nations. Over the next two days, global stock markets crashed, gold outperformed and Treasuries fluctuated heavily. Let’s take a look at all three assets, seeing how they performed during April 2025.
Data Source: LSEG

Data Source: LSEG
Data Source: LSEG
At other times, inflation fears took priority. Concerns that tariffs could reignite price pressures pushed yields higher, hurting long-duration Treasuries. Equities also struggled under rising discount rates. In these moments, SPY and TLT moved together, creating a positive correlation driven by rate sensitivity. Gold often held firmer due to its inflation-hedge characteristics.
The result was not a clean trend but a period of correlation reversals and volatility spikes. Early 2025 reflects a macro transition phase, where markets oscillated between growth fears and inflation risks, rather than responding to a single dominant shock.
Mid-2025: Recession Pricing and Flight to Safety
The most pronounced negative correlation appeared around August and September, with both correlations dropping into negative territories. This was due to weak economic data, rising volatility, and a shift to defensive assets.
During this period, stocks remained pressured and witnessed a major selloff in August, Treasuries rallied, while gold continued to break through new record highs each week as investors shifted to safe-haven assets.
Late 2025 – Early 2026
Toward the end of this sample, correlations stabilized and moved towards neutral, indicating that macroeconomic factors had stabilized, leading to reduced volatility and a more balanced risk environment.
For now, markets are not being driven by one dominant driver, which could signal a path towards normalization.
Over the sample, correlations ranged from approximately -0.6 to +0.6, illustrating that cross-asset relationships can fully invert depending on the dominant macro narrative.
The Broader Takeaway
The rolling correlation analysis reinforces a critical point. Diversification is conditional.
- In growth-driven yield rises, stocks and bonds tend to diverge.
- In inflation shocks, both can fall together.
- In recession scares, bonds often hedge equities.
- Gold responds primarily to real yields and systemic stress rather than equity volatility alone.
Correlations are therefore not fixed structural relationships, they are reflections of the prevailing macro regime.
Investors who monitor shifts in policy expectations, real yields, and growth momentum are better positioned to anticipate when traditional hedges might work, and when they might fail.