ar
ar
- Gold entered October below $4,200 an ounce, around 25% below its January peak.
- US Treasury yields have reached multi-decade highs, increasing the opportunity cost of holding gold.
- Record second-quarter central bank buying and fiscal concerns may be cushioning the decline.
Gold’s path this year has been volatile. After retreating from January’s record highs, it briefly dipped below $4,000 in late June before recovering in August. It then lost more than 6% in September, although it remains around 8% higher than a year ago. ⁽¹⁾
The latest decline has coincided with a sharp rise in US borrowing costs. The 10-year Treasury yield broke above 5% on September 23 and closed near 5.24% on September 28, its highest level since 2007. The 30-year yield closed at 5.56%, its highest since 2004.
Higher yields generally make interest-bearing assets more attractive relative to gold. But the reasons behind the bond selloff also matter. Concerns about government debt and fiscal sustainability can encourage investors to hold gold even as bond returns become more competitive.
The question entering October is whether that demand can continue to cushion the pressure from higher real yields.
Why Higher Yields Weigh on Gold
Gold pays no interest and no dividend. Holding it means giving up whatever a bond or savings account would have paid instead. When yields rise, the opportunity cost of holding a non-yielding asset such as gold generally increases.
That can make bonds relatively more attractive and put downward pressure on gold. The relationship is not mechanical, and factors such as inflation expectations, the dollar, geopolitical risk and investor positioning can override it.
Real yields reflect inflation-adjusted returns. In market analysis, they are commonly measured using Treasury inflation-protected securities, or by subtracting expected inflation from nominal yields.
When nominal yields rise alongside inflation expectations, real yields may slightly change. When real yields rise, interest-bearing assets offer a better inflation-adjusted return, which increases the cost of holding gold.
2013, When the Old Math Held
The clearest recent example came in 2013. Gold fell 28% that year as the US Federal Reserve signaled it would slow its bond-buying program. ⁽²⁾
Most of that decline came in a single quarter, with gold falling more than 20% between April and June. Over the same stretch, the 10-year inflation-protected Treasury yield jumped more than a full percentage point. In May alone, when the yield alone rose 57 basis points. ⁽³⁾
The sequence was not perfectly clean. Gold’s steepest losses in April came roughly two weeks before real yields made their sharpest move, and Reuters tied the decline to a mix of forces beyond the Fed, including a recovering US economy, heavy ETF outflows and softer demand linked to China. ⁽⁴⁾
Even with that caveat, gold’s 2013 collapse coincided with a sharp rise in real yields and expectations of less accommodative Fed policy. It remains a clear example of the opportunity-cost channel at work.
The Channel Is Working, With Less Force
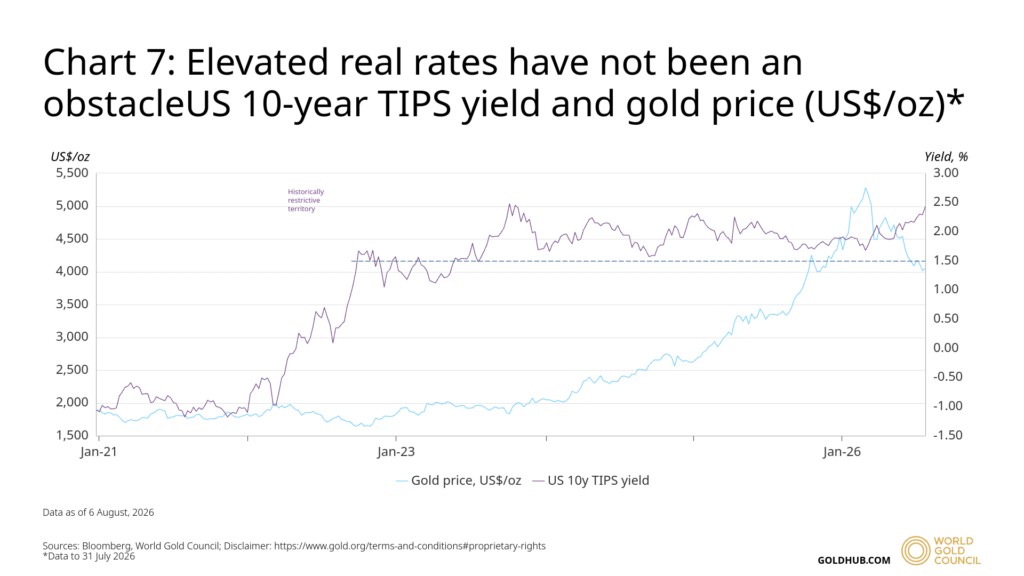
The same channel is visible this year. Real yields have risen sharply, and gold has fallen.
At the September 17 auction, a reopened 10-year Treasury inflation-protected security sold at a real yield of 2.653%, the highest for that term since October 2008. That is about 75 basis points higher than a similar auction in March. ⁽⁵⁾
The high auction yield illustrates the pressure from inflation-adjusted bond returns. However, yields alone cannot explain gold’s performance.
Investor demand helps explain why. Gold-backed ETFs drew $18 billion in August, the second-largest monthly inflow on record. Europe added about $7.9 billion, its largest monthly inflow ever, and North America about $7.7 billion. Global ETF holdings reached a record 4,189 tons. ⁽⁶⁾
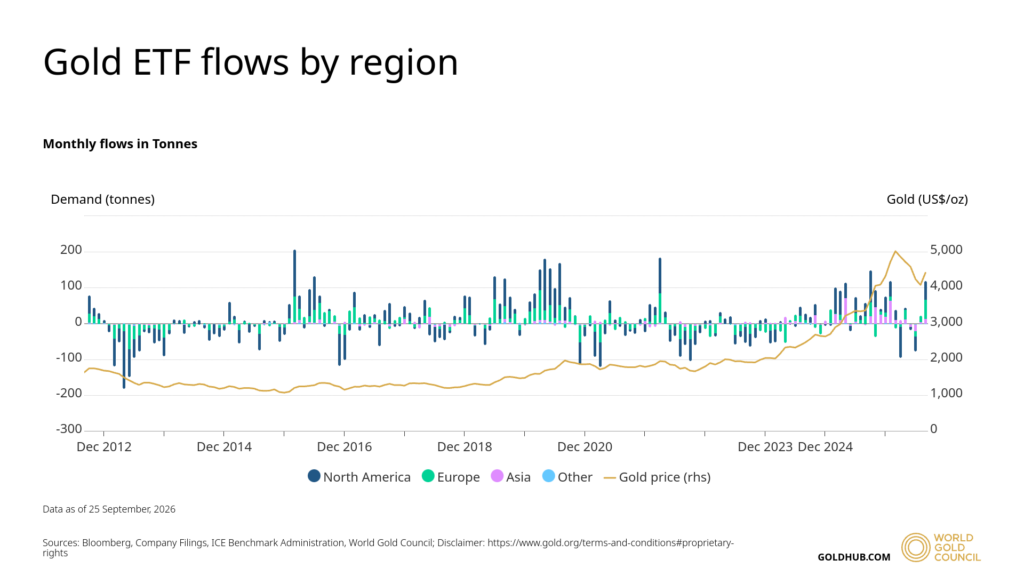
The World Gold Council linked part of that buying to rising concerns about fiscal sustainability and the Treasury market.
That points to a difference in what is driving yields higher. In 2013, rising yields reflected expectations that the Fed would pull back stimulus. This time, the rise in long-term yields has also coincided with heavier government borrowing and growing doubts about fiscal sustainability.
State Street notes that gold and the term premium, the extra return investors demand for holding long-dated bonds, have risen together this decade. ⁽⁷⁾
The distinction matters. Yields rising on stronger growth tend to pull money away from gold. Yields rising on fiscal worries can push some investors toward it, even as the cost of holding it goes up.
289 Tons of Strategic Demand
A second factor is who is buying.
Central banks added roughly 289 tons of gold to reserves in the second quarter of 2026, a record for the second quarter. Poland led the buying, adding 51 tons and taking its total reserves to 632 tons. China added 33 tons, its largest quarterly addition since late 2023, bringing its reported holdings to 2,346 tons. ⁽⁸⁾
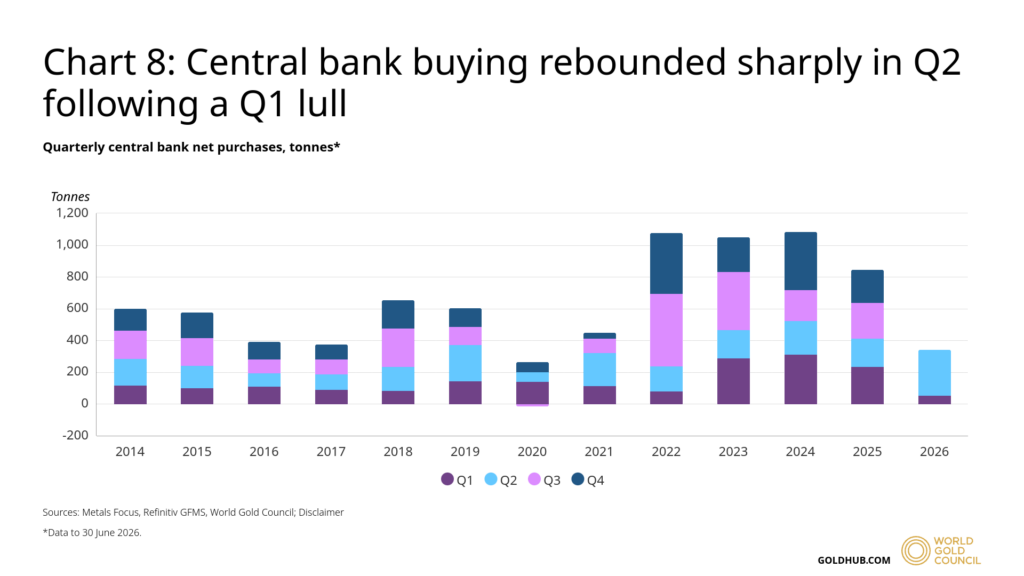
The pace has not been steady. Central bank buying was weak in the first quarter, leaving first-half demand at its lowest since 2022.
The World Gold Council describes central bank demand as strategic, driven by diversification, crisis performance and protection against geopolitical and financial risk, on horizons measured in years rather than a single rate decision. Tactical selling can still occur, driven by liquidity needs or currency management.
That strategic orientation can make central bank demand less sensitive to short-term moves in bond yields than private investment demand.
Dubai’s Stake in the Trade
Gold price swings matter directly in the UAE.
Dubai accounts for around 15% of global gold trade, and DMCC describes the UAE as the world’s second-largest precious metals trading hub. Moves in the gold price flow straight through the emirate’s jewelry and bullion trade. ⁽⁹⁾
The dirham’s peg to the dollar adds a second link. The Central Bank of the UAE’s monetary framework is designed to keep UAE money-market rates aligned with US levels in support of the peg. That means US monetary policy conditions feed into UAE money-market conditions too.
For a broader look at how gold has historically tracked equities and Treasuries through different market regimes, see Daman Markets’ analysis of gold’s correlation with the S&P 500 and US Treasuries.
What Would Change This
The opportunity-cost channel has not disappeared. Higher real yields continue to weigh on gold, while central bank demand and fiscal concerns provide competing support.
The relationship could tighten again if investors come to see higher long-term yields mainly as a sign of stronger growth and tighter monetary policy, rather than as compensation for fiscal and supply risks. A slowdown in central bank or ETF buying would also leave gold more exposed to rising yields.