ar
ar
When traders want to analyze China’s economic performance, they usually look beyond the yuan and go straight to the Australian dollar.
The reason for this is Australia and China are deeply connected economically, and financial markets have long recognized that when China moves, the Aussie tends to follow.
A Relationship Built on Trade
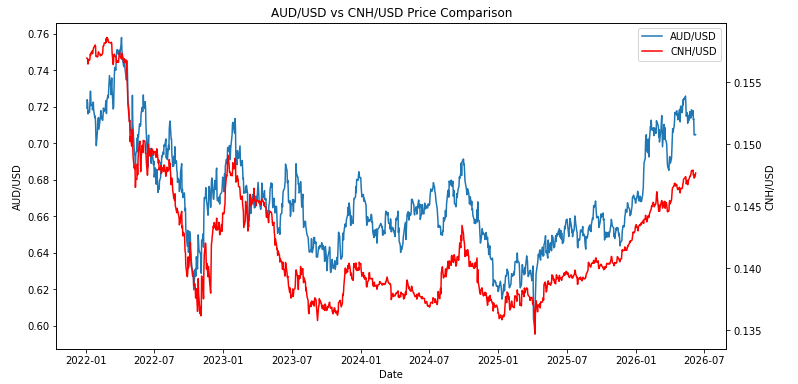
China is Australia’s biggest trading partner, with iron ore, coal, and copper mainly representing the bulk of those shipments.
China relies on these exports to fuel its factories, construction sites, and infrastructure projects. This dependency creates a direct transmission line between Chinese economic performance and the Australian dollar.
When China’s economy expands, demand for raw materials rises. As one of the world’s largest commodity exporters, Australia benefits directly as higher export revenues flow into the economy.
The offshore Chinese yuan, or CNH, has also risen historically in these conditions, reflecting the health of the domestic economy. The result is a correlation between the two currencies that reaches around 0.85 to 0.95, one of the tightest in FX.
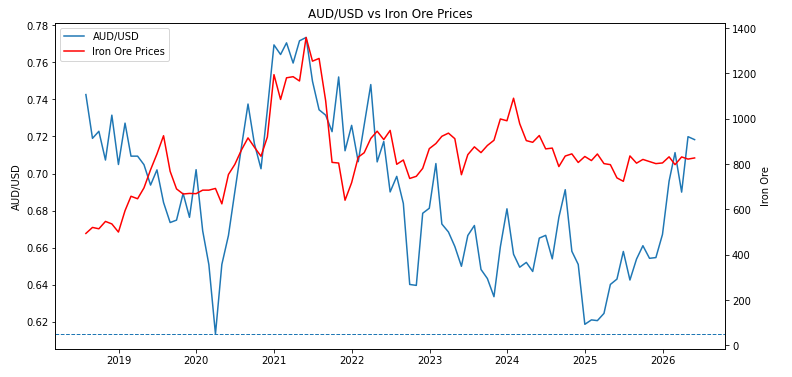
Iron ore is Australia’s largest export to China, representing half of their total export value. When Chinese industrial demand rises, iron ore prices rise, alongside export revenues for Australia, which strengthens the Aussie dollar.
This is why iron ore, rather than export volume data, is a more relevant indicator for traders. Prices move in real time, react instantly to shifts in Chinese demand, and are directly tradeable. Export figures, by contrast, are released with a lag and tell you what has already happened.
The Importance of AUD as a China Proxy
The CNH is a version of the Chinese yuan traded outside of mainland China and managed mainly by the People’s Bank of China (PBoC).
The PBoC sets a daily reference rate for the yuan, and the currency can only move within a limited range above or below that level during the trading day. That means the currency does not respond easily to market movements.
The Aussie dollar, however, floats freely, where it trades every day with high liquidity and tight spreads, which is why traders who want to express their views on Chinese growth use AUD/USD rather than the yuan.
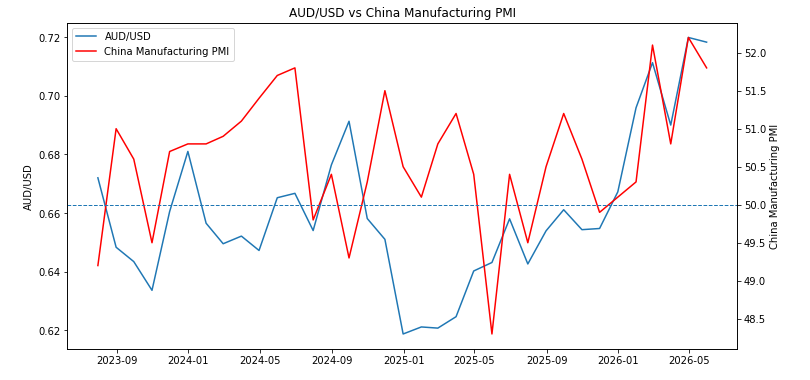
The chart above shows how AUD/USD often reacts to shifts in China’s manufacturing PMI. The relationship is not perfect, but when Chinese factory activity improves, it can support commodity demand and strengthen sentiment toward the Australian dollar.
The AUD here is used as a proxy, where traders monitor China’s manufacturing performance not just as an economic indicator, but also as a forward signal for the AUD, making it very important to watch for AUD traders.
Where Things Stand Right Now
The current macro picture has grown complex, with geopolitical tensions, high energy prices, and diverging central bank paths all showing mixed signals.
The Reserve Bank of Australia (RBA) is one of the major central banks that is now more hawkish this year, raising its Cash Rate from 3.60% to 4.35% to counter inflation currently sitting around 4.2%, well above its target range of 2-3%.
China started 2026 with a growth target range of 4.5%-5% and a fiscal deficit of around 4% of GDP. The Chinese government is committed to maintaining economic support through infrastructure spending, investments in technology, managed bond issuance and special monetary policy tools. ⁽¹⁾
China’s inflation data showed a more complicated picture, with producer prices rising 3.9% YoY in May, its fastest pace since July 2022. This was driven by higher raw material costs and strong AI-driven investments for metals.
Consumer prices, however, remained weak at 1.2%, showing that cost pressures are rising at the factory level while household demand remains relatively weak. ⁽²⁾
More importantly, the PBoC has continued to prioritize yuan stability, using its daily fixing and policy signals to lean against sharp depreciation, while trade tensions play on in the background.
On the trade front, China’s exports rose 19.4% YoY last month, coming in well above its forecast of 15%, driven largely by AI-related technology goods. Shipments to the US jumped to their highest level since March 2021, while the trade surplus widened to $105.4 billion. ⁽³⁾
However, economists have warned that these gains may be short-lived. Once overseas stockpiling momentum fades, sluggish domestic consumption may be unable to fill the gap.
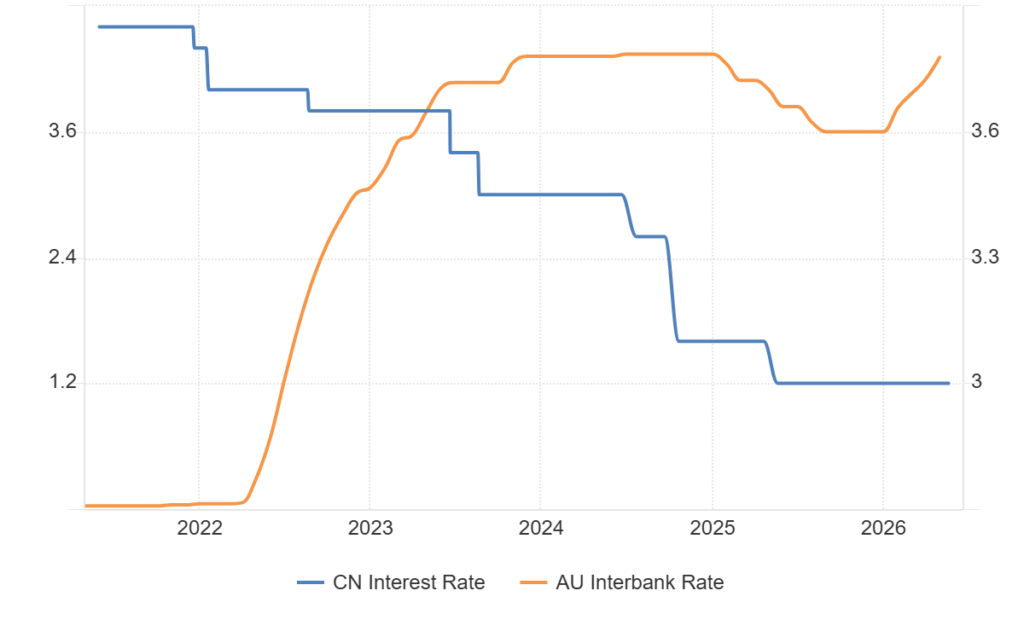
The chart above shows the divergence between the RBA and the PBoC. Australia’s central bank started to hike rates aggressively in 2022 and resumed its cycle this year after a period of rate cuts and pauses. Meanwhile, the PBoC moved in the opposite direction, focusing on supporting slow economic growth.
Risks to Watch
Several risks could disrupt the current picture. A deterioration in Chinese domestic demand looks like the most immediate threat. Weak consumer spending and a fragile property sector could dampen commodity demand and weigh on the AUD before the CNH reacts.
A sharp rally in the US dollar could hit both currencies simultaneously.
The Middle East conflict cuts both ways, supportive of commodity prices in the short-term, but any further escalation could raise input costs and squeeze Chinese industrial activity.