ar
ar
Every time you put on the news or read a news article on the economy or currencies, you see bond yields rising or dropping.
That’s often due to factors like monetary policy changes, major currency moves, or changes in politics. Mostly the 2-year yield and the 10-year yield capture most of the headlines. But why do these benchmarks get so much attention and what do they indicate?
Both are market yields on US government debt and act as important reference rates across financial markets.
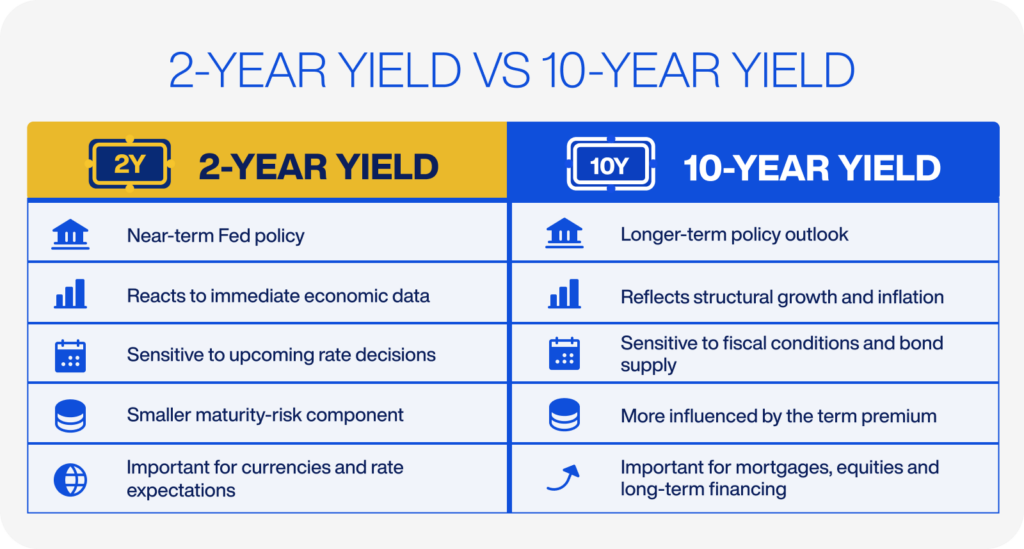
The 2-year yield is tied more closely to the expected path of monetary policy, while the 10-year yield captures a broader mix of expected interest rates, inflation, growth and long-term risk.
Bond prices and their yields move in opposite directions. When the price of a bond rises, its yield falls. When selling pushes its price lower, the yield rises.
What the 2-Year Yield Represents
The 2-year yield is very sensitive to what financial markets expect the central bank to do over the next few years.
Inflation, employment, wage growth and economic activity can all change these expectations. If inflation exceeds forecasts, traders might expect more rate hikes, fewer cuts or rates staying higher for longer, pushing the 2-year yield higher.
However, when the 2-year yield declines, it usually points to expectations of lower policy rates due to many factors, such as weak growth or lower inflation.
A gradual decline caused by easing inflation may support financial markets, while a sharp fall following weak employment data or financial stress may signal recession fears.
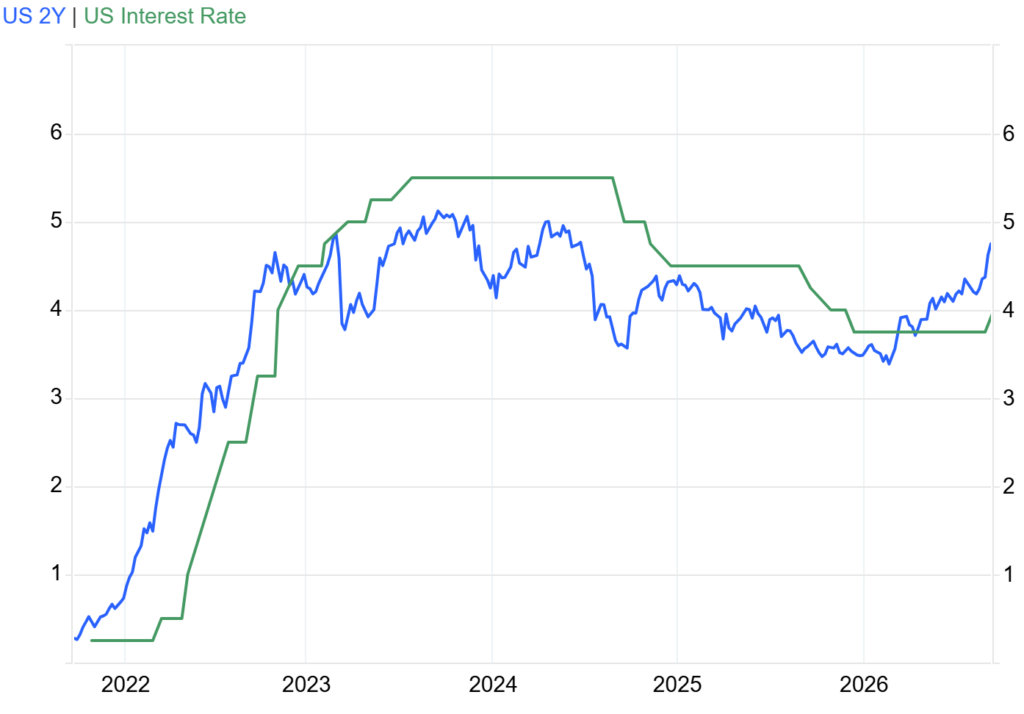
It often moves ahead of the policy rate because it reflects expectations for future Federal Reserve decisions, rather than only the current rate.
The 2-year yield is also important in currency markets when yields are compared across countries.
If one central bank is expected to follow a more restrictive policy path than another, its country’s 2-year yield may rise relative to its counterpart.
This widens the yield advantage and can support the currency, although political, financial and geopolitical risks can sometimes outweigh that advantage.
What the 10-Year Yield Represents
The 10-year yield looks further ahead, reflected by expectations of interest rates over the decade, together with inflation compensation and a term premium, which is the additional return investors may demand for holding a longer-dated bond.
Unlike the 2-year yield, the 10-year responds to more than short-term central bank expectations. Growth, inflation, government finances and bond supply all play a part as drivers in the 10-year yield.
If the economy is growing, inflation is persistent or the government runs a larger fiscal deficit, the yield on the 10-year bond could be pushed higher. Conversely, recession fears and safe-haven demand can pull its yield lower.
The 10-year yield also matters beyond the bond market, where it influences mortgage rates and corporate borrowing costs and is widely used as a reference rate in asset valuations.
A sharp increase in the 10-year yield can pressure equities, particularly growth and technology stocks whose valuations depend heavily on earnings expected several years into the future. It can also affect the US dollar, gold and other interest-rate-sensitive assets.
Reading the 2s10s Yield Curve
The 2s10s spread measures the difference between the two yields:
2s10s spread = 10-year yield − 2-year yield
A positive spread means the 10-year yield is higher than the 2-year yield, which produces an upward sloping curve. This usually reflects expectations for stronger growth and higher compensation for lending over longer maturities.
When the 2-year yield is above the 10-year yield, the spread turns negative and the curve is inverted. It often appears when monetary policy is restrictive and investors expect growth and interest rates to fall later on.
Inversions in the yield curve have been spotted before many US recessions, but they are not a guarantee, and they say little about when a downturn might actually start.
The curve steepens when the gap between the two yields widens and flattens when it narrows. What drives the move matters as much as its direction.
A bull steepening happens when short-term yields fall faster than long-term yields. It often follows easing inflation and rising expectations for rate cuts. It can also point to economic weakness, though, if markets expect the Fed to cut rates sharply to counter financial stress or a recession.
When long-term yields rise faster than short-term yields, the curve undergoes bear steepening. This is due to stronger growth, persistent inflation, high bond supply or rising term premium.
A bear flattening occurs when short-term yields rise faster than long-term yields, often because markets expect tighter central-bank policy. A bull flattening occurs when long-term yields fall faster than short-term yields, often because investors expect weaker growth, lower inflation or stronger safe-haven demand.
Because it raises long-term borrowing costs, bear steepening can tighten financial conditions and pressure risk assets.
A Curve That’s Been Here Before
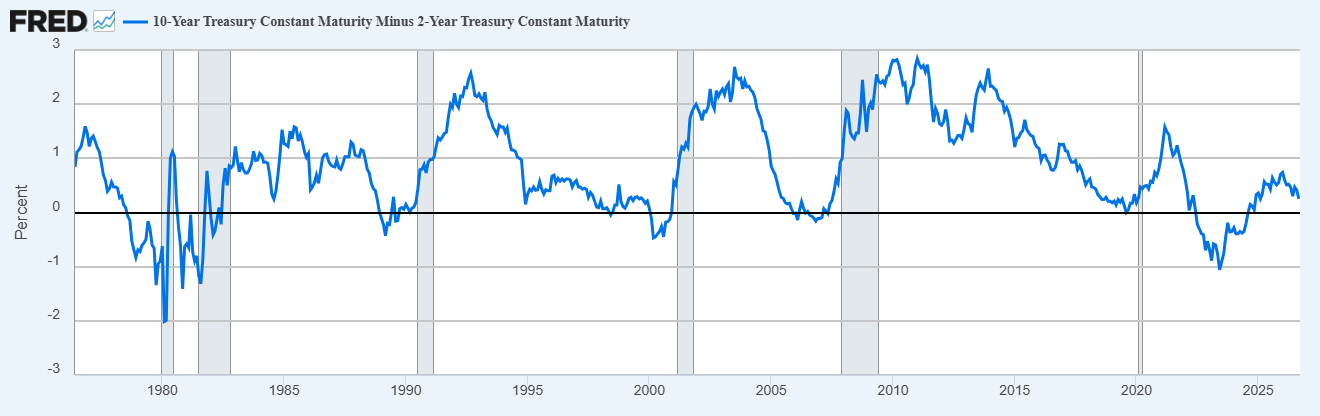
This isn’t the first time the 2s10s spread has been in the spotlight. From July 2022 to September 2024, it remained inverted during that time, marking its longest inversion since records began in 1976.
Source: Federal Reserve Bank of St. Louis via FRED (Shaded Areas are Recessions)
Historically, 2s10s inversions have preceded many US recessions, which is why the 2022–2024 episode attracted so much attention. It also coincided with an aggressive Federal Reserve tightening cycle that lifted the federal funds target range from near zero to 5.25%–5.50%.
However, the economy did not enter recession during this record-long inversion or its subsequent normalization. The curve returned to positive territory and remained positive through 2025 as the Fed cut rates and economic growth held up.
This period showed that an inverted yield curve should not be treated as an automatic recession signal. Its message should be considered alongside employment, consumption, credit conditions and broader economic data.
The return to a positive curve is not automatically a sign that recession risks have disappeared either. In previous cycles, recessions sometimes began after the curve started steepening again because the Fed was cutting rates in response to economic weakness.
So the main question isn’t whether the curve is steepening, but which part of the curve is driving the move.
The Bond Market in September 2026
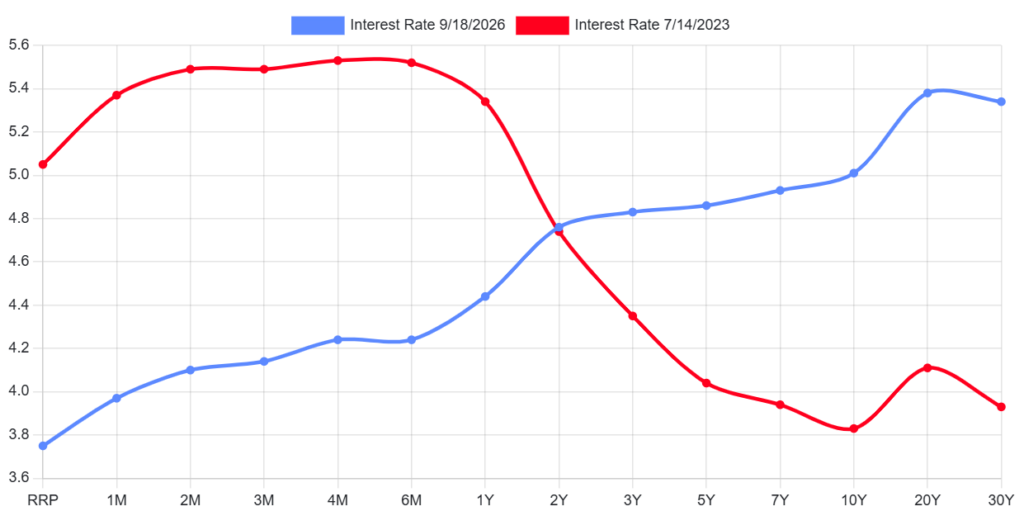
The 2s10s segment of the Treasury curve remains positively sloped, but yields are high across maturities.
After the Federal Reserve’s latest decision on September 16, the 2-year yield jumped to around 4.73%, the 10-year traded around 5%, and the 30-year at 5.35%, This placed the 2s10s spread near 28 basis points.
The 2-year yield was supported by tighter monetary policy expectations. The Federal Reserve hiked interest rates by 25 basis points to a range of 3.75%-4.00%, its first rate hike since 2023 in a unanimous decision.
The dot-plot showed that 16 of 18 policymakers expect at least one more rate hike this year. That outlook caused traders to price in a more restrictive short-term policy path, which kept the 2-year yield elevated.
The long end of the curve is facing a new set of drivers. Heavy Treasury issuance, a growing fiscal deficit, persistent inflation risk and rising demand for capital have increased the amount of debt competing for investor demand.
Heavy corporate borrowing, including for AI projects, has also added pressure on long-term yields. ⁽¹⁾
As a result, higher 10-year and 30-year yields reflect not only Fed policy but also concerns about rising bond supply and the extra return investors demand to hold long-term debt. Hawkish policy signals from other major central banks have also supported global bond yields.
Moving on beyond the Fed, the Treasury has expanded its long-end liquidity-support buyback program. Beginning on September 9, the Treasury expanded its existing liquidity-support buyback program in the 10-to-20-year and 20-to-30-year sectors, from $2 billion to $4 billion per operation, and followed up with a one-off $6 billion operation in the 10-to-20-year sector, triple the normal size.
The goal is to keep the market functioning smoothly rather than to push yields down the way Fed quantitative easing does.
However, the expanded buybacks have so far had only a limited effect on broader market conditions. The operations remain small relative to the size of the long-end Treasury market and have not materially eased the pressure created by heavy issuance, fiscal concerns and weak investor demand.
Yields continued to rise after the expansion, although this alone is not a direct measure of the program’s success.
How This Spills Over into Other Markets
The combination of elevated yields and a rate hike doesn’t just impact the bond market. Its effects spill over into other asset classes as well.
Stocks can get hit the hardest, as higher yields weigh on large-cap growth and AI-linked companies whose value depends on earnings expected way in the future. Financials tend to hold up better, since a steeper curve widens the gap between what the bank pays on deposits and what they earn on loans.
The broader market also has to absorb rising corporate borrowing costs, which squeeze margins for companies that need to refinance debt or fund expansion.
Currencies are strongly influenced by 2-year yield differentials between countries, as these reflect expectations for the relative paths of central-bank policy. A widening US yield advantage over economies where rates are expected to remain lower can support the dollar.
This is related to, but not the same as, the two-year yield differential. The midpoint of the Fed’s 3.75%–4.00% target range is 3.875%, around 138 basis points above the ECB’s 2.50% deposit rate, a spread of approximately −138 basis points when calculated as ECB minus Fed.
The gap could narrow if the ECB tightens more aggressively than the Fed, although further tightening from both central banks would leave it broadly unchanged.
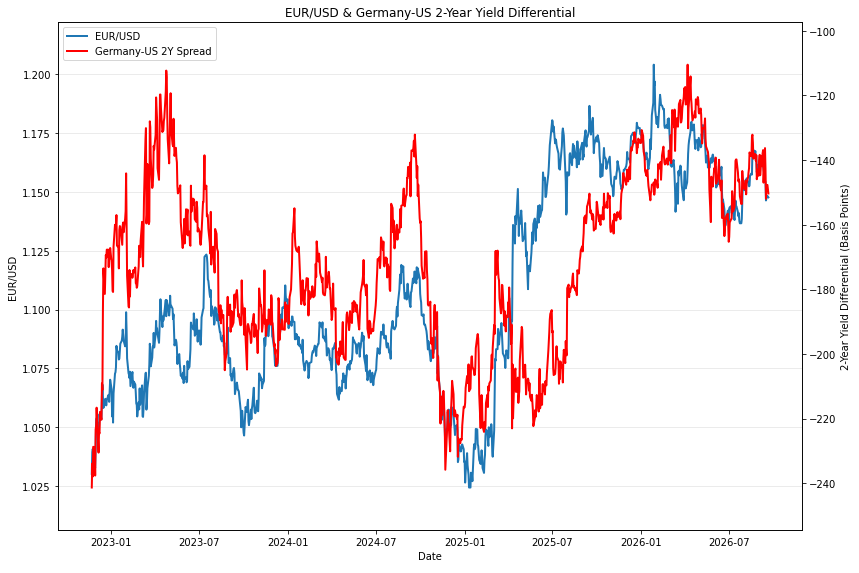
The chart above shows the 2-year yield spread between Germany (highly tied to ECB policy expectations) and the US, indicating a negative spread, which is an advantage to the US yield.
That support is not always guaranteed though. If US yields rise because markets expect tighter Fed policy or stronger economic growth, the dollar would probably benefit.
However, if long-term yields rise because investors are demanding greater compensation for fiscal or inflation risk, the dollar’s reaction becomes less certain.
Even then, broader risk-off flows could support the dollar while hurting higher-yielding currencies and emerging markets that rely on dollar funding.
At the moment, gold is caught in a tug of war. Safe-haven demand and steady central bank buying support it, while higher yields raise the cost of holding an asset that pays no interest.
What Traders Should Watch
Traders can check which yield is leading the move. If the 2-year is leading, watch inflation data, jobs data and Fed signals. If the 10-year is leading, watch Treasury auctions, deficit news and the Treasury’s November 4 refunding, where buyback sizes get updated. ⁽²⁾
For the dollar, moves in yields can be compared with yields in other major economies, since that gap helps drive currency moves. The curve does not give a full forecast on its own, but it shows which risks the bond market is pricing most aggressively.