ar
ar
Gone are the days when traders strictly focus on price action data when taking trades. Today, even the most passionate price action trader uses moving averages to identify market trends.
Expert traders now realise that a wise combination of price action, volume action, and the best trading indicators is the way to go.
Yet, with hundreds of indicators available on trading platforms, it can be hard to know which ones to choose. Many traders are lost in analysis-paralysis, while seeking the confluence of tens of indicators.
The reality is that you only need to master a few indicators for certain specific purposes (identifying trends, measuring trend momentum, identifying entry and exit, assessing market volatility, and managing risk).
In this article, we will focus on 6 of the best trading indicators that will serve these purposes and support your overall trading strategy. We’ll cover:
- The 6 best trading indicators for technical analysis
- Tips for combining technical indicators with price and volume action
Excited? Let’s get started.
Do you want to trade stocks, commodities, forex, indices, cryptos, and futures in the UAE? Sign up with Daman Markets for access to advanced trading tools and educational resources from expert traders.
1. The 6 Best Trading Indicators for Technical Analysis
Moving Averages
Overview
A moving average is an indicator that smooths out the historical price of an asset by creating an average price (closing price) over a given time period.
Moving averages are constantly updated as we move through new trading days. For example, a 50-day moving average (MA) as of the time of writing will include data from the previous 50 trading days (as far back as November 15 ).
By tomorrow, the 50 trading days will now exclude November 1 and include the previous day, resulting in a new figure for the 50 MA.
Moving averages are lagging indicators since they rely on past price data. There are two types of moving averages:
- Simple moving averages (SMAs): SMAs give the same value to all trading days. To use the previous example, for a 50 SMA, all 50 of the previous trading days will be treated equally. The most popular SMAs are the 50 SMA, 100 SMA, and 200 SMA.
- Exponential moving averages (EMAs): EMAs give more value to recent prices. This means they react faster to short-term price fluctuations, making them more effective for short-term trading. No wonder many consider EMAs the best indicator for intraday trading. The most popular EMAs are the 9-day EMA, 20-day EMA, 21-day EMA, 50-day EMA, 100-day EMA, and the 200-day EMA.
How it works
Moving averages are used for three main purposes:
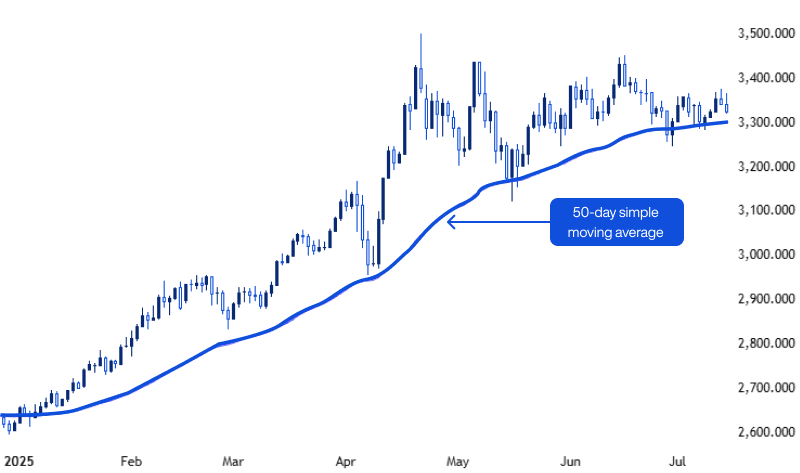
1. Trend identification: When a moving average (simple or exponential) is trending upward, we are in an uptrend, and vice versa. In the example below, the market is in a downtrend between March and June as the 50 SMA trends downward. A trend change happened, and it went on an uptrend between June and September.
50-day Simple Moving Average
Though identifying trend direction (upward or downward) with moving averages is easy, you should be careful to understand the timeframe you are dealing with.
EMAs react quickly to recent price changes, which makes them appropriate for identifying short-term trends. Again, this is why they are considered the best indicator for intra-day trading and scalping.
Thus, if you are analysing the market’s trend in the short-term, you might focus on 9 EMA, 12 EMA, 20 EMA, and 21 EMA.
For medium-term trends, you can use the 50 EMA and the 50 SMA, while the 200 SMA gives you a good view of the long-term trend.
Since SMAs tend to focus on the medium and long term, they are considered some of the best indicators for swing trading.
2. Dynamic support and resistance: Marking out support and resistance zones is one of the key tenets of price action trading.
Interestingly, moving averages are also helpful here.
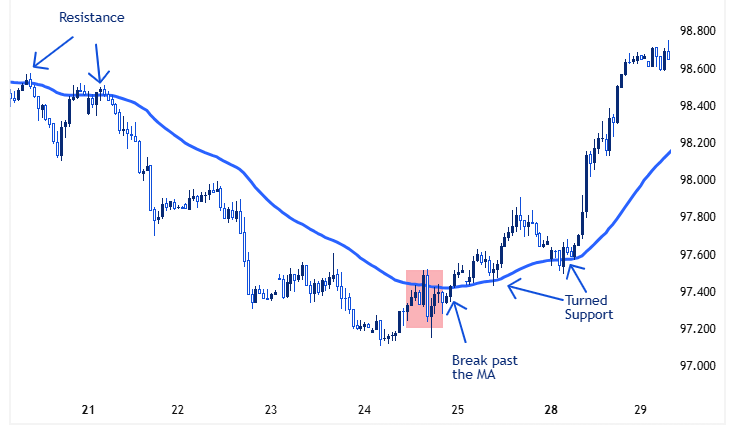
In the chart below, the 50 EMA acted as resistance for this forex pair until it was broken to the upside. After this, the 50 EMA turned into a dynamic support level.
Moving Averages as Dynamic Support and Resistance Levels
3. Entry and exit: There are two popular moving average strategies for identifying potential entry and exits.
First is the price and the MA crossover. When price cuts through a relevant MA from below, traders might expect the price to keep going up, and vice versa.
The chart below provides examples of both a bearish crossover (price cuts MA from above) and a bullish crossover (price cuts MA from below):
Price and Moving Average Crossover

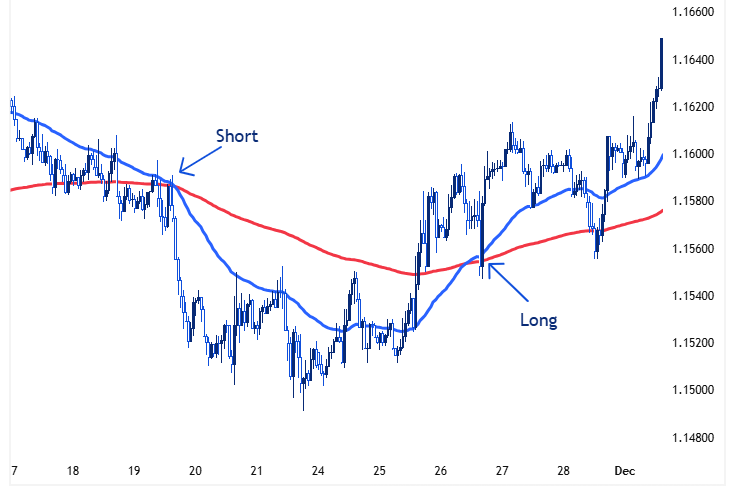
The second strategy is known as Moving Average Crossover. Here, the price moves up when a short-term MA (usually the 50MA) cuts through a long-term MA (usually the 200MA) from below (the golden cross), and vice versa (the death cross).
MA Crossover
2. Bollinger Bands
Overview
Bollinger Bands (BBs) are overlays on the price charts that measure the volatility of different trading instruments.
Sample Bollinger Bands
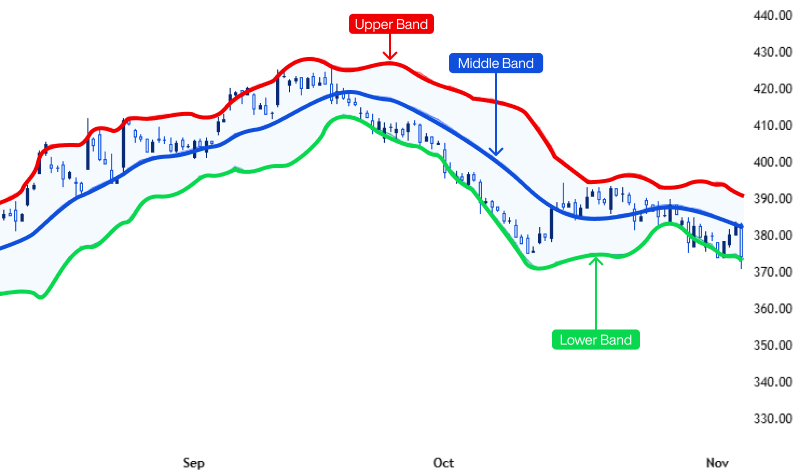
A bollinger band has three main components, as seen in the chart above:
- Middle band: The middle band of a bollinger band usually represents the 20 SMA, a measure of short-term trend (as we have explained above).
- Upper band: The upper band is the 20 SMA plus two standard deviations (which measure how current prices deviate from historical price movements).
- Lower band: The lower band is the 20 SMA minus two standard deviations.
Though these are the standard settings, you can always change the SMA and the number of standard deviations (1.5, 2, and 2.5 are the popular options).
These changes can reflect your trading approach. For example, the top technical indicators for day trading will focus on short-term trends, while swing traders will prioritise medium-to-long-term trends.
How it works
There are four major uses of BBs:
1. Measurement of volatility: When the gaps between BBs widen, that is a sign that volatility is increasing (given that the upper and lower bands are standard deviations from the MA), and vice versa.
Bollinger Bands and Volatility Measurement

In the chart above, the gaps between the bands are tight from the 8th to the 12th. After that, the gaps widen over the following week.
This shows that the volatility of this asset is increasing.
For some traders, lower volatility is a sign that a trend is ending (losing its force) while higher volatility is a prelude to a new trend. In the chart above, the increase in volatility was the harbinger of a new uptrend.
2. Identifying overbought and oversold conditions: Though expert traders now realise that an asset being overbought or oversold is not in itself an indication of an immediate reversal, identifying such conditions remains an important part of technical analysis.
When price hugs the upper band, the market is in overbought conditions, and vice versa, as seen in the chart below.
Using Bollinger Bands to Identify Overbought and Oversold Conditions
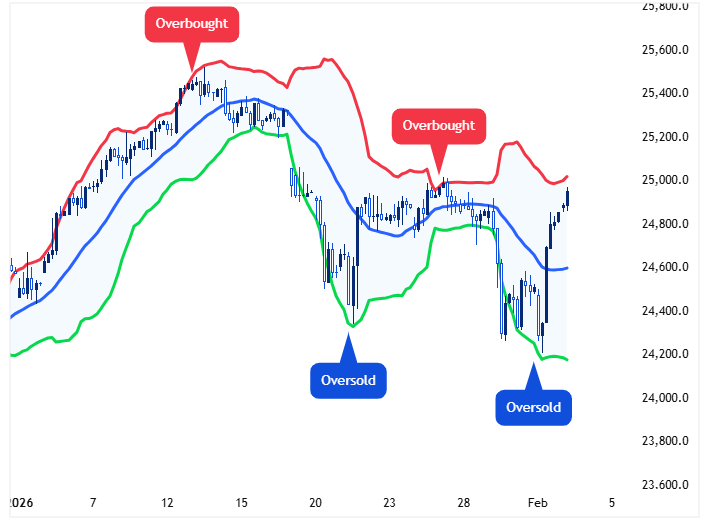
3. Support and resistance: The upper band can act as a resistance zone while the lower band acts as a support zone, as seen below:
Bollinger Bands as Support and Resistance Zones
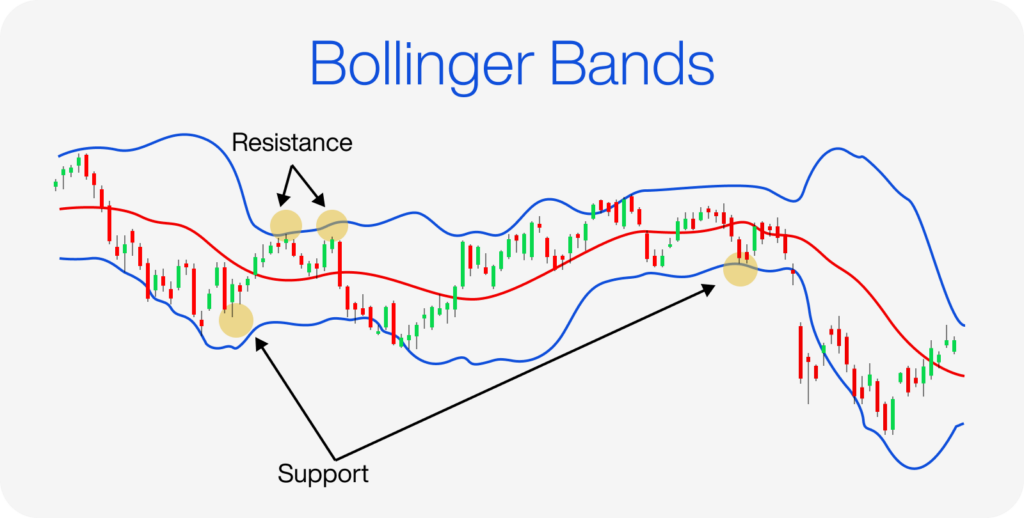
4. Entry and exit: Some traders see price going above the upper band or below the lower band as a signal of possible breakouts. Also, we have seen that a change in volatility is perceived as a sign of a potential reversal.
When BBs act as support and resistance in ranging markets, some traders buy at the lower band and sell at the upper band. More cautious traders will buy when the price falls below the medium band and sell when it crosses above it.
3. Relative Strength Index (RSI)
Overview
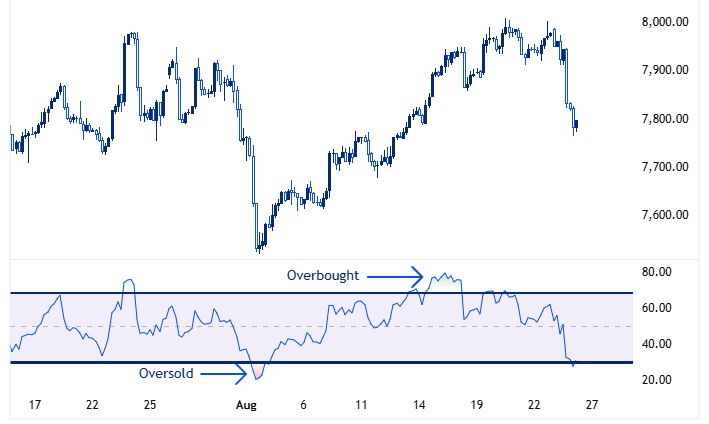
The RSI is a momentum oscillator that measures the speed and size of recent price changes.
It is one of the top technical indicators for day trading. One reason for this is that it pays attention to recent price changes (past 14 days). RSI values range from 0 to 100.
A Sample Relative Strength Index
How it works
There are at least three ways to use this indicator:
- Identify overbought and oversold conditions: It is popular to see RSI values above 70 as evidence that we are in overbought conditions and below 30 as proof that we are in oversold conditions.
- Trend direction: When we are in an uptrend, the RSI tends to be above 50, and vice versa.
- Entry and exit signals: There are multiple ways to use the RSI for entry and exit signals.
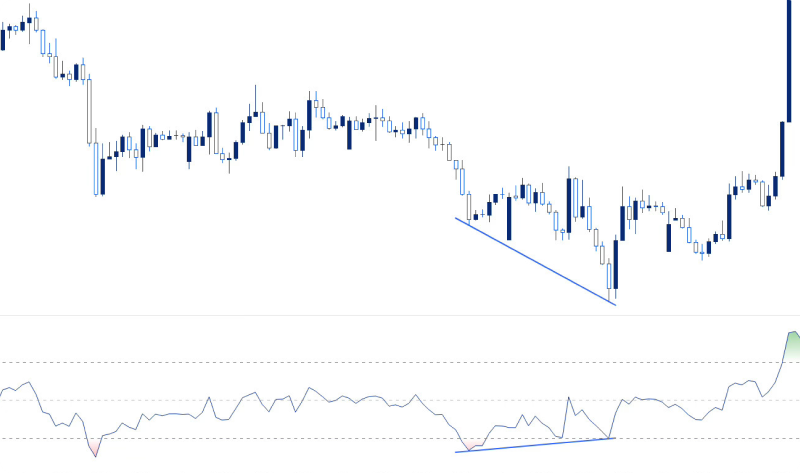
First, common price chart patterns (double tops and double bottoms, for example) are often evident in the RSI also. These can indicate possible trend reversal and continuation.
For example, we can see in the chart below that a divergence occurred between the price and the RSI. The price formed a lower low while the RSI formed a higher low, which indicated a bullish divergence and caused the price to go up.
Chart Patterns on the RSI
Second, when the RSI and price chart diverge, it can indicate that the price chart is lagging and the price movements will soon align with the RSI.
“If your security is trending upward and the momentum indicator is pointing downward, you have a divergence,” said Barbara Rockefeller, an economist and forex expert. “The uptrend is at risk of pausing, retracing, or even reversing.”
Also, if the price chart is showing lower lows (downtrend) but RSI is showing higher lows (uptrend), that could be a signal that a trend reversal (bearish to bullish) on the price chart is imminent.
Below are other examples of how RSI divergence works:
How to Interpret RSI Divergence

Third, some traders sell when the RSI leaves an overbought condition and buy when it leaves an oversold condition.
4. Moving Average Convergence Divergence (MACD)
Overview
MACD is one of the best technical trading indicators used by all types of traders. It shows the relationship (convergence and divergence) between two moving averages.
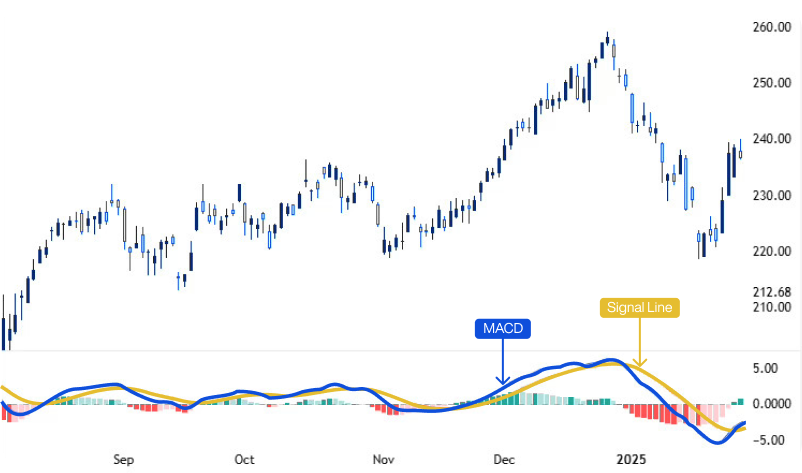
There are three components of the MACD indicator:
- MACD line: This line shows the difference between two EMAs, usually the 12 EMA and the 26 EMA.
- Signal line: The signal line is the 9EMA of the MACD line itself.
- Histogram: The histogram is a visual representation of the difference between the MACD line and the signal line.
Sample MACD Indicator
How it works
The MACD indicator has three main functions:
- Trend direction: When the MACD line is above zero, the market is in an uptrend, and vice versa.
- Trend momentum: When the MACD histogram bars grow in size, momentum is increasing, and vice versa. Since histogram bars can be green or red, growing or shrinking histogram bars can indicate a stronger bullish or bearish trend.
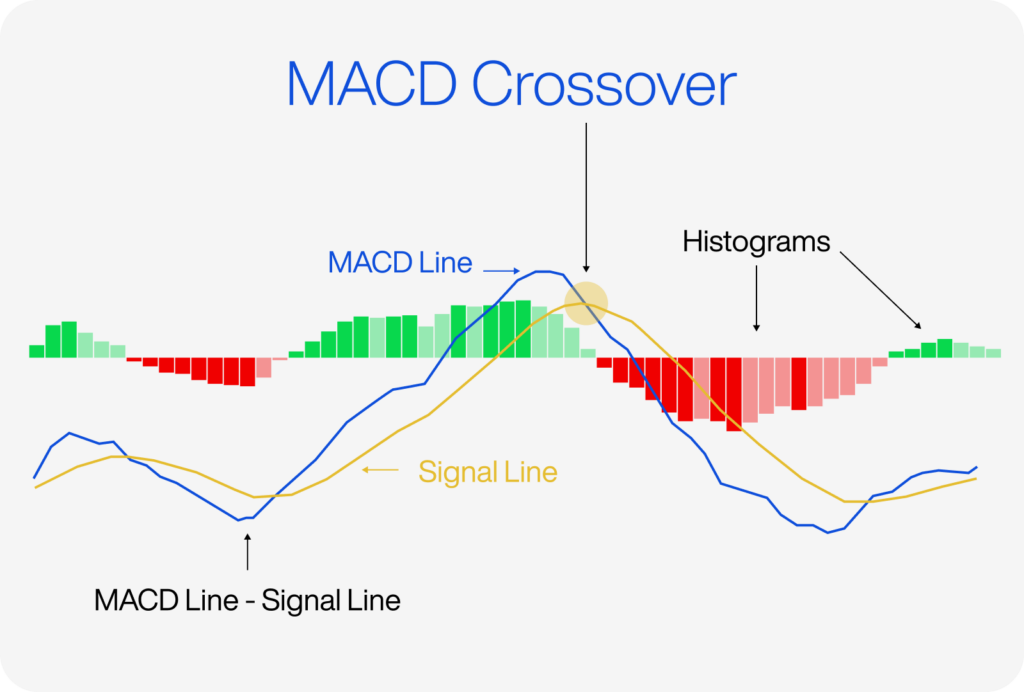
- Entry and exit: When the MACD line crosses the signal line from below, there is a possible move to the upside, and vice versa.
MACD Crossover
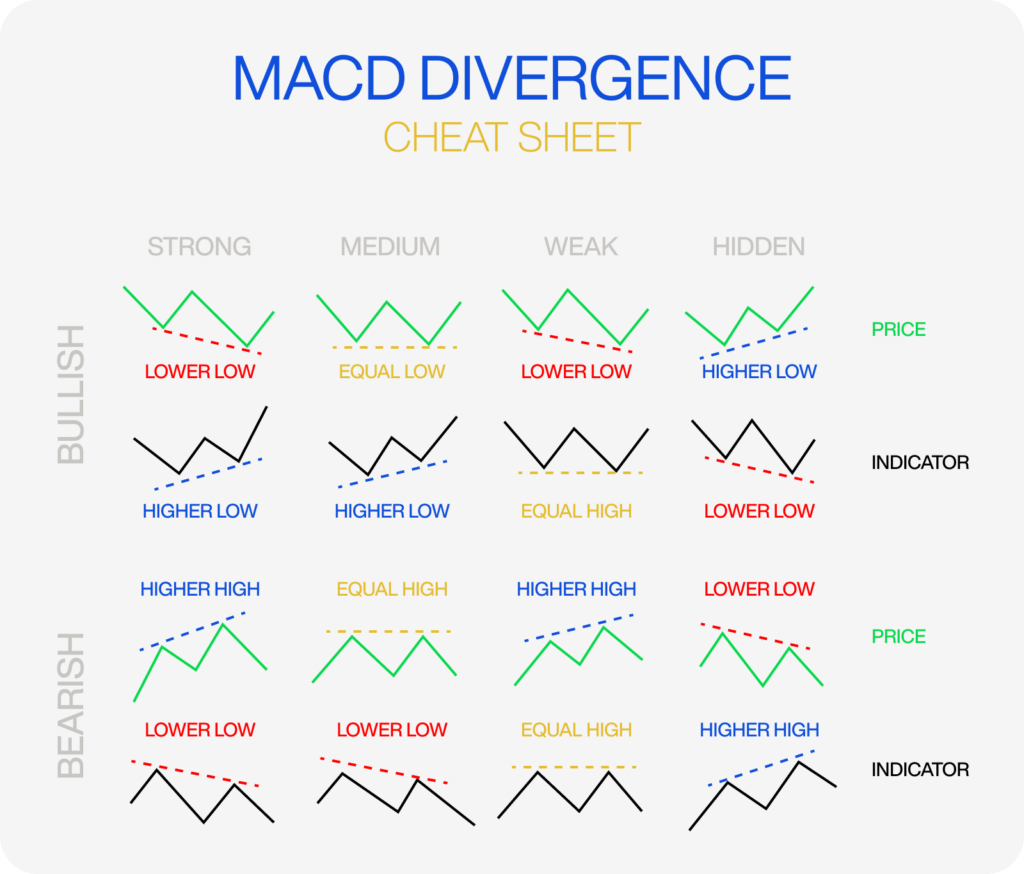
Also, when the MACD trend diverges from the price trend, it can be a sign that price movements will soon change to match the MACD.
MACD Divergence
5. Average Directional Index (ADX)
Overview
ADX is one of the best momentum indicators preferred by momentum and trend-following traders. It shows the momentum of current trends, and its value ranges from 0 to 100.
There are three components of the ADX:
- +DI or +DMI (positive directional indicator): This shows the sum of the difference between today’s and yesterday’s high prices over the past 14 trading days.
- -DI or -DMI (negative directional indicator): This shows the sum of the difference between today’s and yesterday’s low prices over the past 14 trading days.
- The ADX line: This plots the moving average of the +DI and -DI, usually over the past 14 days. It can also be considered as the average of the price range (high price minus low price) of an asset over a given period.
ADX Indicator
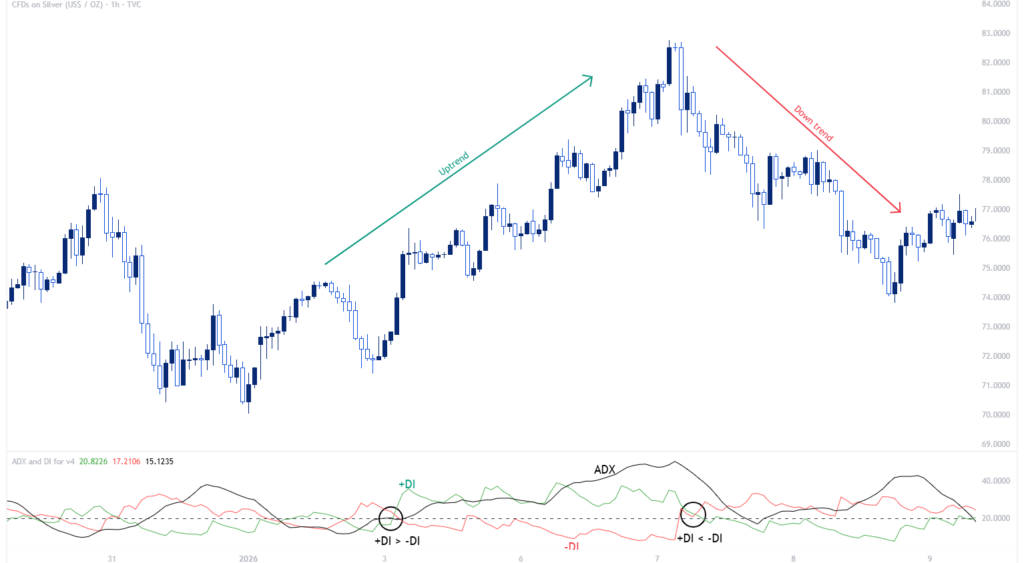
ADX Indicator / Source: TradingView
How it works
There are three ways to use this indicator:
- Trend momentum: An ADX below 20 shows a weak trend or even a ranging market. When it’s between 25 and 50, the trend is strong. ADX values can also exceed 50 when the market trend is very strong.
- Trend direction: When the +DI line is above the -DI line, the market is in an uptrend, and vice versa.
- Entry and exit: Some traders see the ADX rising above 25 (transitioning from a weak to a strong trend) as a buy signal and it falling below 20 (current trend is ending) as a sell signal.
6. Average True Range (ATR)
Overview
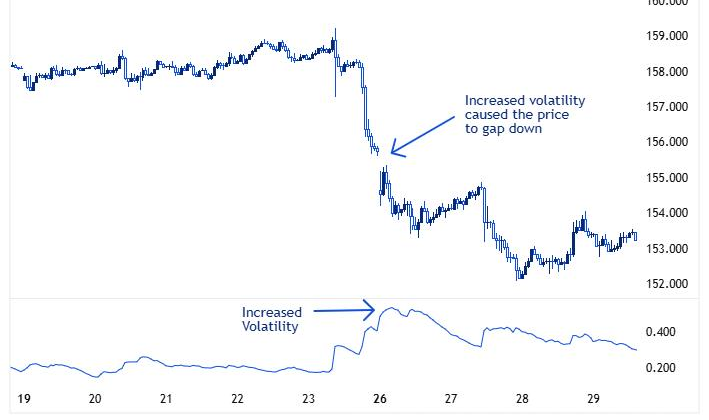
The last of our best trading indicators is the ATR. It measures how an asset moves within a given period.
The true range of an asset is the highest of its current high minus its current low, the absolute value of its current high minus its previous close, and the absolute value of its current low minus its previous close.
When you find the mean of the True Ranges over a given period (usually 14 periods), you get the ATR.
Sample Average True Range
How it works
There are two major ways to use the ATR:
1. Risk management: Many traders use ATRs to set trailing-stop loss to avoid too-tight stop losses in volatile financial markets.
Using ATR to Set Stop Loss
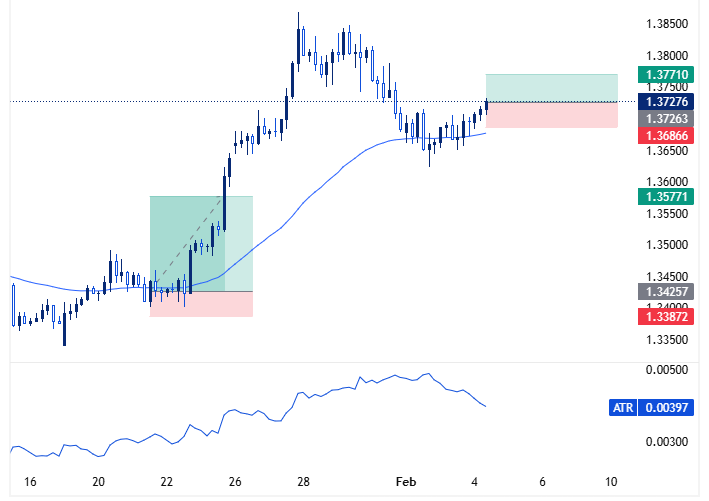
Also, many traders adjust their position size depending on the current ATR – smaller positions when the ATR is high and larger positions when the ATR is low.
2. Volatility measurement: A high ATR means high volatility, and vice versa.
If you trade particular assets, you are probably wondering which one applies to you the most. For example, which indicator is the best for forex trading or which is the best indicator for gold trading?
Interestingly, all the best trading indicators we have covered apply across all asset classes. What matters most is your trading strategy and your trading style (intra-day, swing, scalping), as we have tried to emphasise.
Tips for Combining Technical Indicators with Price and Volume Action
Experts usually discourage an approach to trading that obsesses over price charts. Many beginners make the opposite mistake: exclusive focus on trading indicators.
The best approach, as all expert traders have found, is to combine price action, volume action, and trading indicators in your toolbox.
Below are some tips for doing this:
- Start by understanding price and volume action: Though indicators are powerful, understanding the price chart is the beginning of sound technical analysis. This includes identifying market trends, confirming trend momentum with volume data, mapping areas of value (support level, resistance level, fair value gaps, trendlines, channels, Fibonacci Retracement levels, etc.), identifying chart patterns, pinpointing candlestick patterns, and forecasting future price movements.
- Use indicators as confirmations: Once you understand what the price chart is saying, you can use indicators for confirmations. For example, moving averages can confirm trend direction, BBs and ADX can ascertain momentum, MACD crossovers and divergences can verify areas of value, and ATR can help with risk management.
- Don’t use too many indicators: Once you have done the foundational work of reading the price chart, you can focus on only one indicator for each of the functions we have highlighted. For example, you can stick to MAs for trend direction instead of combining 10 different trend indicators. Having too many indicators can lead to confusion. If a single indicator can serve two functions well, you should use it for both to reduce the total number of indicators you need to use.
- Set your indicators to match your trading strategy: We have seen that the same indicator can be the best for intraday trading and swing trading, depending on the settings you use. The most important factor is whether your strategy and style thrive on short-, medium-, or long-term technical analysis. Each indicator you use should be set up in a way that aligns with your preferred time frame as a scalper, day trader, swing trader, or position trader.
- Learn to adapt to different market conditions: Moving averages and MACD are very useful in trending markets, while the RSI (or Stochastic Oscillator) may be more appropriate in ranging markets. Also, when dealing with volatile assets (like gold and cryptocurrencies), the ATR becomes very important for risk management and position sizing.
- Backtest your strategy: Once you have chosen your indicators, you need to backtest them together with your price and trading volume action strategies to see if they work.
“While fiddling with indicator parameters is optional, backtesting to get gain/loss data and other information is not,” according to Rockefeller. “You simply have to do it, or else you’ll be flying blind.”
Stick to them if they work, and choose different indicators or modify your price and volume action strategies if they don’t.
Some popular indicators we have not mentioned include Ichimoku Cloud, On-Balance Volume (OBV), Fibonacci Retracements, and Pivot Points. You may find any of them more in alignment with your strategy.
Whatever strategy you choose, you will need a broker that provides the right tools and features that will help you execute them.
At Daman Markets, we provide you with everything you need to successfully execute your trading strategies in the UAE. Whether you are seeking how to invest in gold in the UAE or how to execute the best crude oil trading strategy, you have come to the right place.
Our AI-powered research tools (Acuity Research Terminal) provide all the information you need for thorough fundamental and market sentiment analysis.
We also provide real-time prices and high liquidity, which reduces bid-ask spreads and ensures transactions are processed immediately.
Our educational resources will provide you with information to help you make better trading decisions, and our personalised support will help you get the best out of the platform.
Are you ready to execute your trading strategies, backed by sound technical analysis? Register today with Daman Markets for convenient, cost-effective, and secure multi-asset trading in the UAE.
Takeaways
- Mastering a small set of technical indicators serving various functions is more effective than stacking conflicting signals.
- Each indicator should have a clear job. Use MAs for trend, RSI/MACD for momentum and timing, ADX for trend strength, and ATR for market volatility and risk management.
- The strongest setups come from price action and volume, with indicators used strictly for confirmations.
- How you set up an indicator is also important. The same indicator can suit intraday, swing, or position trading depending on how it’s configured.