ar
ar
- PMI stands for Purchasing Managers’ Index. A reading above 50 signals economic expansion; below 50 signals contraction.
- Manufacturing, Services, and Composite PMI each measure a different layer of economic activity.
- For commodity markets, Manufacturing PMI carries direct weight, since weaker readings reduce oil demand expectations and can shift futures pricing even without a supply-side event.
Every month, purchasing managers at hundreds of companies around the world are asked one question.
Is business better or worse than last month?
Their answers are compiled into one of the most closely watched numbers in global finance. It is called the Purchasing Managers’ Index, or PMI.
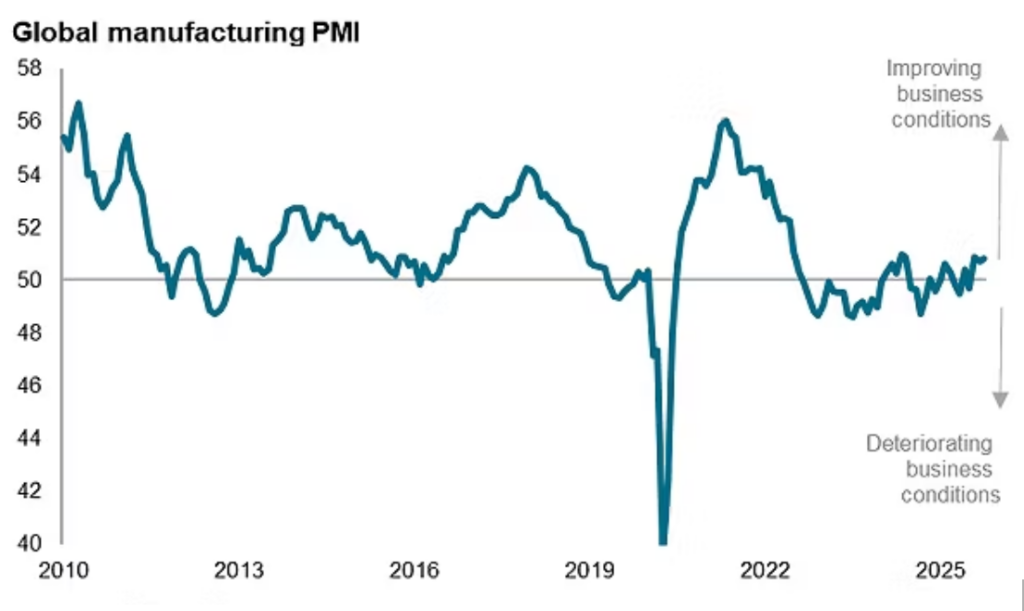
The responses are converted into a diffusion index between 0 and 100. A reading above 50 signals expansion compared with the previous month, while a reading below 50 signals contraction. ⁽¹⁾
Who Publishes PMI Data?
PMI data is published by two main organisations. In the United States, the Institute for Supply Management (ISM) produces the most widely followed readings.
Globally, S&P Global publishes PMI data for over 40 countries, making it the primary source for international comparisons. The two methodologies differ slightly, which is why US traders often track both the ISM and S&P Global readings for a fuller picture.
Flash vs Final PMI
PMI is released in two stages. The flash estimate arrives roughly a week before the end of each month, based on around 85% of total survey responses. It is the reading markets react to most sharply, because it is the first real signal of where economic momentum is heading.
The final reading follows at the start of the next month, incorporating the full dataset. It rarely moves far from the flash estimate, but revisions do happen. And when they do, they can shift market positioning, particularly if the final number crosses the 50 threshold in either direction.
For traders, the flash release is the one to watch. The final reading acts as the confirmation.
How PMI Moves Markets
PMI arrives before most official economic data. GDP figures are published weeks after a quarter ends. PMI gives markets a read on momentum at the start of every month, well ahead of quarterly GDP figures and official output data.
When a PMI reading beats expectations, equity markets can gain traction. Bond yields often follow, as investors price in stronger growth and the prospect of tighter monetary policy. A miss can trigger the reverse within seconds of the release.
Markets react quickly because PMI is forward-looking. It reflects what purchasing managers are ordering and planning, not what the economy has already produced.
Manufacturing, Services, and Composite
Three versions of the PMI cover different parts of the economy.
Manufacturing PMI tracks factory activity such as new orders, output levels, employment, supplier delivery times, and inventory levels. ⁽²⁾ It is the version most directly tied to commodity demand, because industrial production consumes raw materials and fuel.

Services PMI covers the broader economy, including finance, retail, hospitality, and professional services. Because services make up the majority of GDP in most developed economies, a weak Services PMI can signal wider economic slowdown even when manufacturing holds up.
Composite PMI combines both. It gives the fullest picture of overall economic health and is the figure most commonly cited in financial media.
PMI and Oil Markets
Factory activity drives fuel demand. When Manufacturing PMI falls in large economies like the US or China, markets read it as a signal of weaker industrial consumption ahead.
A sustained run of below-50 readings has historically coincided with periods of softer oil demand. Traders revise their consumption expectations, and those revisions feed into Brent crude and other commodity futures pricing.
This is why a PMI miss can move oil prices even when nothing has changed on the supply side. The market is adjusting what it expects will be consumed, not what is currently available.
When PMI weakness combines with existing supply-side pressure, the two signals compound. That dynamic was visible when global PMI signalled a mixed growth picture across major economies, adding a demand-side layer to an already fragile commodity outlook.
When PMI Loses Its Signal
PMI is a sentiment survey. It captures what purchasing managers expect and not what has already happened.
During supply disruptions or geopolitical shocks, PMI can diverge sharply from actual market conditions. Oil prices can surge even as PMI contracts, if a supply event overrides the demand signal.
Conversely, a PMI expansion reading can coincide with tightening financial conditions that slow growth anyway.
The index is a reliable directional indicator, but it is not a precise forecast of what markets will do next.