ar
Markets are usually driven by multiple macroeconomic factors at the same time. These drivers could be inflation, interest rates, the US dollar, sentiment, or other things. Monitoring only one indicator isn’t enough to justify the macro regime and fully understand market trends.
Nowadays, financial markets are being pulled in two directions. Equities are still showing resiliency, supported by strong earnings and tolerant risk appetite in some parts of the markets, while inflationary pressures have returned to the macro picture, being driven by higher energy prices and geopolitical tensions, driving alongside it bond yields and the US dollar.
This means we can’t just assume that markets are in a risk-on mood only because stocks are reaching record highs. The current environment just got more complicated, with current conditions showing stagflation risks, where inflationary pressures are rising while growth signals remain uncertain.
The current macro regime is best described as mixed, because cross-asset behavior has not fully confirmed a stagflation regime.
This matters in the current environment because inflation risk has moved back into focus. The Federal Reserve’s April 29 statement noted that inflation remains elevated, partly due to higher global energy prices.
Why a Regime Framework Matters
A macro regime framework becomes useful when using several macro variables to determine which force is currently driving financial markets.
The model used here tracks five main drivers:
| Driver | Possible measure used |
| Growth | Equity performance, economic surprise data, or growth-sensitive assets |
| Inflation | WTI oil and 10-year breakeven inflation expectations |
| Interest Rates | Treasury yields or Fed rate expectations |
| Risk Stress | VIX, credit spreads, or volatility indicators |
| US Dollar | DXY |
The objective of this analysis is not to predict the next macro regime or market movements, but to understand which variable is currently driving market conditions. The model starts from the early 2010s to the present day.
How the Inflation Driver is Measured
In this study, the inflation driver is measured by using oil prices and changes in 10-year breakeven inflation expectations.
The oil benchmark used here is West Texas Intermediate (WTI) because the study is mainly focused on US economic conditions. WTI is used as a proxy for energy price pressures, while the 10-year breakeven inflation rate shows how markets are pricing future inflation expectations.
When energy prices rise and inflation expectations move higher, the impact can feed into bond yields, central bank expectations, currency markets and equity valuations.
This distinction is important. The model does not say oil is the only inflation driver. Instead, it treats oil as one of the main channels through which inflation pressure can enter financial markets.
Why Inflation is Back in Focus
Recent market conditions show that oil prices have moved higher as the conflict between the US and Iran has disrupted shipments of both oil and gas in the Strait of Hormuz, increasing concerns about further energy supply disruptions.
At the same time, equities have not fully broken down. This indicates a mixed setup, with inflation rising while risk appetite is still active in the markets. This explains why the current macro picture is described as inflation-sensitive rather than fully risk-off sentiment.
Monetary policy also remains sensitive to these movements. If energy prices remain elevated, inflation expectations may rise further, keeping US yields and the US dollar supported.
This creates a difficult challenge for the Federal Reserve, as it spent almost four years bringing inflation down by keeping interest rates higher. If energy prices remain elevated, inflation expectations may rise again, making it harder for policymakers to come up with a clear decision, especially with deep divisions among Fed policymakers.
That is why an inflation-led market environment is very hard for investors to assess.
What the Current Macro Drivers Show
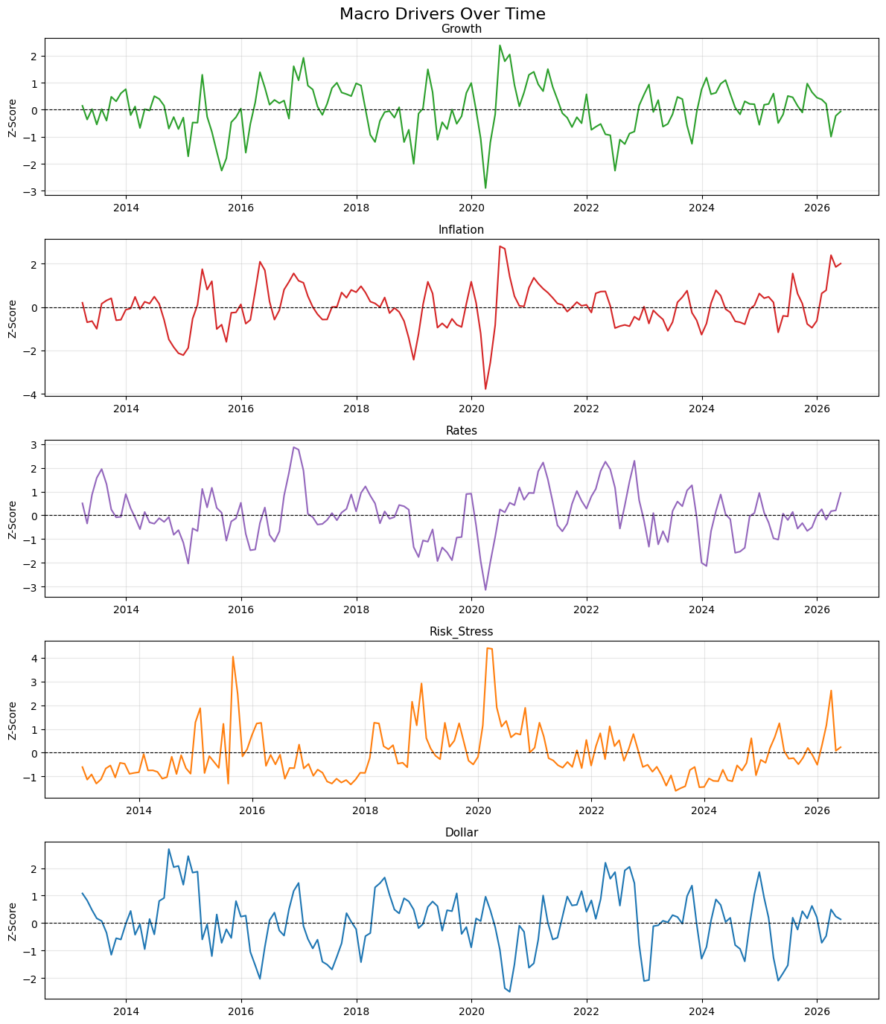
The charts above show how each variable drives macro conditions. A higher reading means the variable is the main driver.
Before moving on, here’s a quick explanation of the z-score.
The macro driver chart helps explain why the current environment cannot be described by stocks alone.
Inflation pressure has become a more dominant driver, while risk stress has moved earlier in March 2026 but then pulled back, which is not strongly enough to confirm a full risk-off macro regime. This supports the idea that markets are not in panic mode, but they are still being influenced by inflation-related pressure.
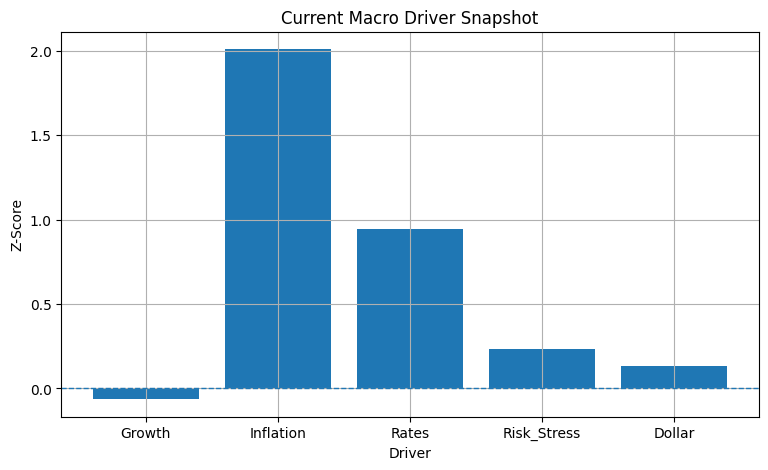
Based on the model, inflation is currently driving macro conditions alongside interest rates. Risk stress remains also a driver but less dominant, while growth is slightly negative. This creates a mixed environment where inflation is shaping market movements, but the overall macro regime is not confirming a stagflation environment.
That distinction matters because inflation can rise even though stocks remain resilient. Stocks can hold up due to strong earnings, sector concentration, current AI investments, and liquidity conditions.
At the same time, oil, yields, and the dollar can still point to a tighter and more inflation-sensitive backdrop.
Why Stocks Are Holding Up Against Inflationary Pressures
Equities remaining resilient does not mean that markets are in a risk-on environment. Stock indices can remain strong sometimes despite macro risks rising.
Many large-cap stocks remain resilient in their performance, which supports investor confidence. Market concentration also played a role in stock market resiliency, especially when the Magnificent 7 stocks are keeping sentiment elevated due to high investments in AI despite mixed macro conditions.
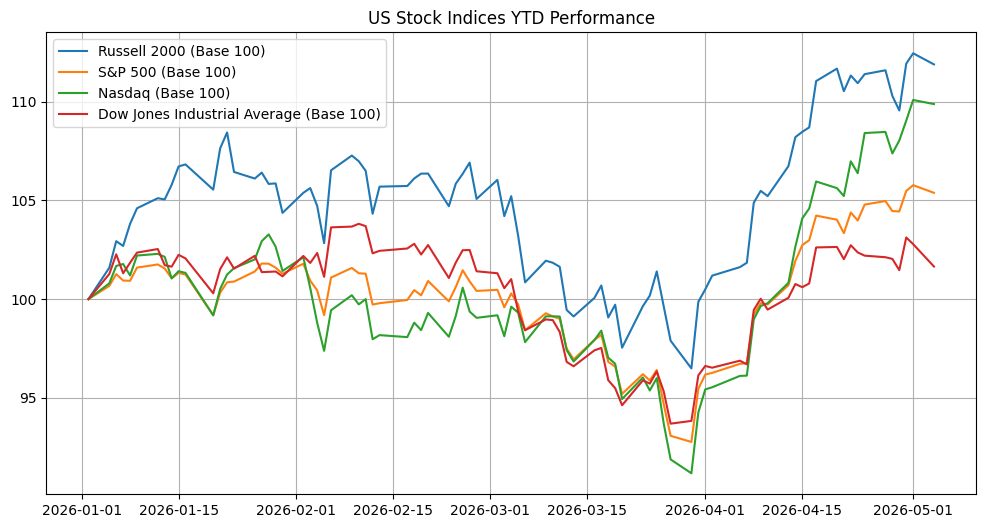
However, this doesn’t remove inflation concerns. If oil prices remain elevated and inflation expectations continue to rise, bond yields might stay higher, which could weigh on valuations, especially for growth stocks and small companies, which are more sensitive to monetary policy changes.
Small-cap stocks, which are represented by the Russell 2000, are more important to watch in this environment due to their high sensitivity to domestic changes in financing conditions.
How Assets Usually Behave Across Regimes
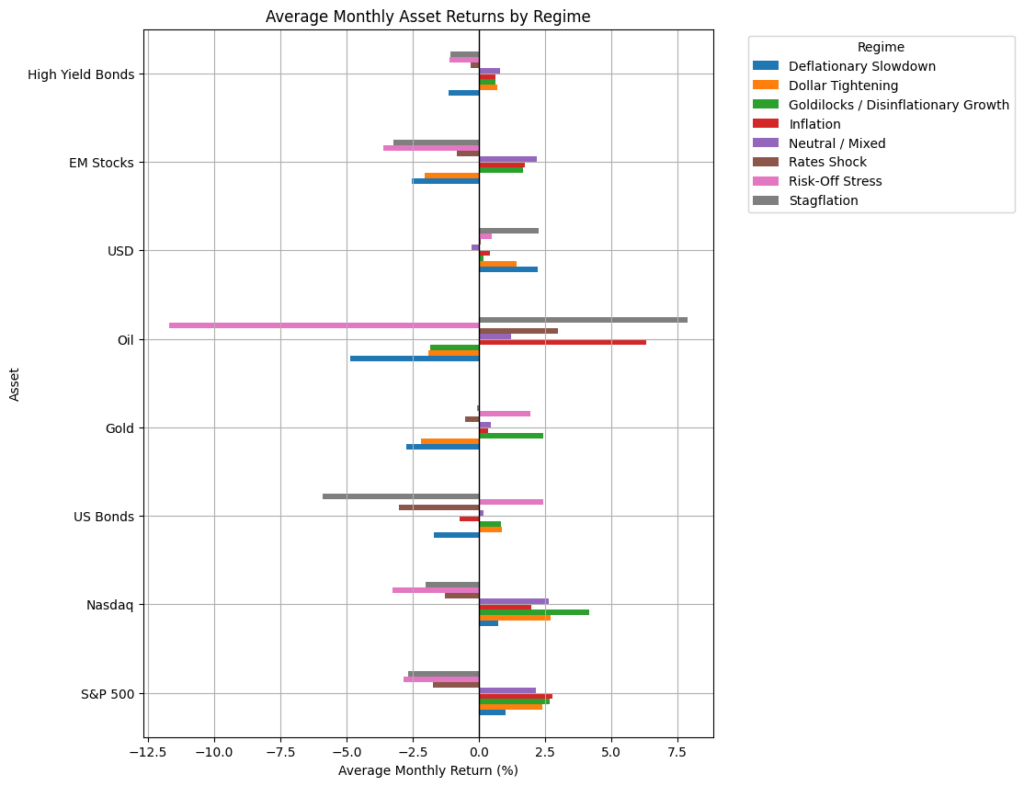
The chart above shows historical performance across major asset classes throughout various macro regimes. It also provides more proof that inflation can create a mixed environment rather than a risk-on or risk-off setup.
Bonds might be under pressure when yields rise, while gold can be sensitive to major moves from the US dollar and yields.
Oil prices could benefit from inflation-driven periods due to their large part of the inflation channel, especially during times of stagflation, as it is seen as a hedge.
Overall, the chart highlights that asset behavior can vary significantly depending on the macro regime, so these results should be viewed as a historical framework rather than a prediction of future performance.
Inflation-Sensitive, Not Fully Risk-Off
Overall, the current macro environment is now inflation-sensitive, but still hasn’t sounded off the alarm yet for a full risk-off mode. Oil prices and breakeven expectations have pushed inflation higher, while equities have remained strong.
That is why the latest macro regime remains driven by mixed variables, even though inflation is the dominant driver.
The key takeaway is that stocks have continued to move higher for now while inflation is still shaping the broader market backdrop, making WTI, bond yields, the US dollar, and risk stress important indicators to watch together.