ar

- Getting commodities right does not guarantee getting the currency right. CAD, NOK and AUD have recently shown weak connections with the broad commodity index.
- Oil still has a historical connection with the Canadian dollar and Norwegian krone, but it explains only part of their movements.
- Each country’s export mix matters. Interest-rate expectations and demand for US dollars can offset the support currencies receive from higher commodity prices.
For years, traders treated the Canadian, Australian, and Norwegian currencies as stand-ins for commodities. When oil rose, the loonie and the krone were supposed to follow.
Brent is now trading around $110 per barrel as concerns over Middle East supply disruption supported prices, despite hopes of more Russian fuel exports following a sanctions waiver from the US.
For anyone using the Canadian dollar or Norwegian krone as an oil trade, those swings raise a practical problem: getting crude right does not guarantee getting the currency right.
Longer-term data show a positive relationship between Brent and both CAD and NOK. Meanwhile, all three currencies show weaker recent correlations with the broad CRB commodity index.
Higher export prices still help. But the short answer is that these currencies follow commodities mostly when rates and the dollar stay out of the way, and this year they have not.
What the Monthly Numbers Show
The chart compares monthly returns on AUD/USD, CAD/USD, and NOK/USD with monthly returns on the CRB commodity index. Each reading covers the previous 36 months, with the window moving forward one month at a time.
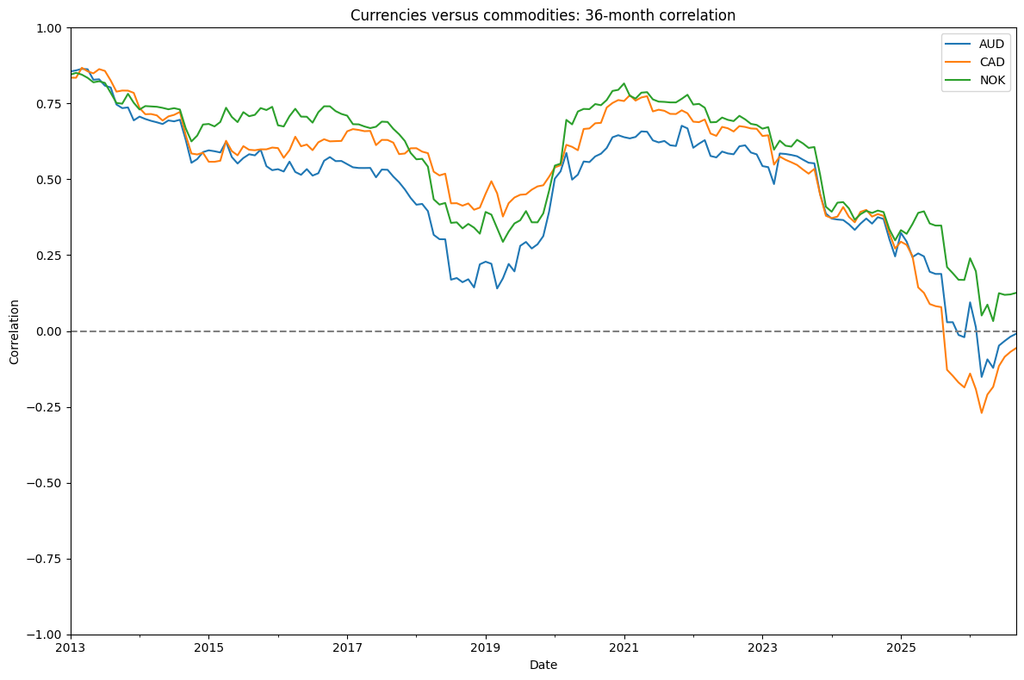
In 2013, correlations were high, but weakened towards 2019, then recovered sharply around 2020 and 2021. By September 2026, the Norwegian krone’s reading was around 0.12, while the Aussie dollar was close to zero, and the Canadian dollar was slightly negative.
The latest readings show a weak connection over the past three years. That does not mean commodities have stopped influencing these currencies.
The Oil Shock Was the Test
The rolling chart moves slowly. Each reading covers 36 months, so this year’s oil spike is only a small part of the September numbers. To see how the currencies handled the shock itself, you have to look at the months since it began.
Since June, Brent is up 26%, yet the Canadian dollar has slipped 0.8% and the krone has risen 5.6%.
The reason behind a commodity rally matters. Stronger global demand can support export prices alongside economic activity. A disruption in supply chains, however, can raise prices and increase business costs, making investors more cautious.
An oil exporter should gain from a swing like that, but the Federal Reserve got in the way. Oil pushed inflation higher, and the Fed raised rates in September, its first hike in more than three years. A stronger dollar and higher US yields work against currencies tied to dollar-priced commodities.
More recently, expectations have shifted. The US 10-year Treasury yield traded around 5.13%. Investors are also expecting the Federal Reserve to hold rates at its upcoming meeting following the September hike. Even with oil above $100, changing interest-rate expectations can alter the appeal of commodity currencies.
Canada: Oil Explains Part of the Movements
The Canadian dollar is linked with oil, but that relationship doesn’t explain every move.
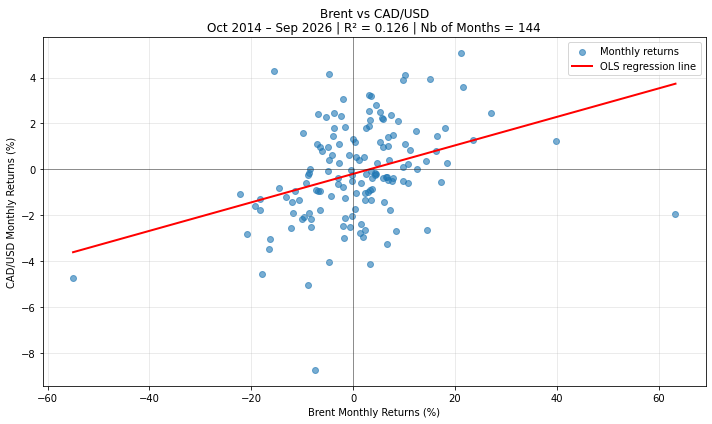
The chart uses 12 years of monthly data, from October 2014 to September 2026, with each dot representing one month. The red line slopes upward, showing that oil and the Canadian dollar tended to move in the same direction in these 12 years.
The model’s R² of 0.126 means Brent price changes helped explain 12.6% of CAD’s monthly fluctuations over the 12-year sample. Most of the currency’s movement remained unexplained by this model.
Recent trading shows why other factors deserve attention. On October 16, the loonie was heading towards its first weekly gain after five consecutive weekly declines, helped by firmer oil and a weaker US dollar. Earlier, weak Canadian jobs data had reduced expectations of a Bank of Canada rate hike, pressuring the currency. ⁽¹⁾
Norway: A Stronger Historical Link, Weak Recent Readings
The scatter plot for the Norwegian krone covers the same 12-year period. Its upward sloping line also shows that stronger oil performance generally went alongside a stronger currency.
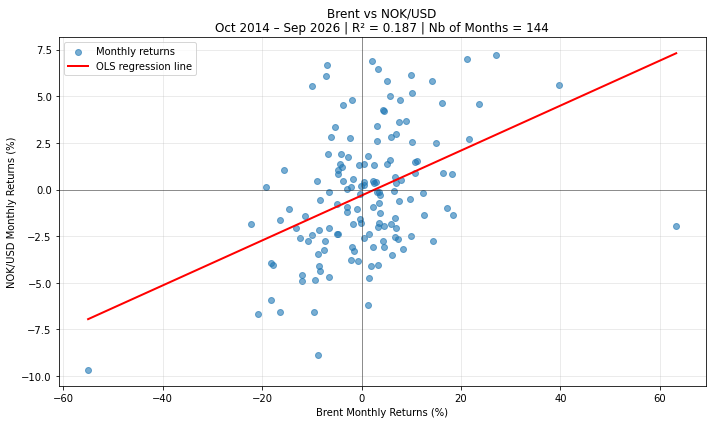
Oil movements helped explain 18.7% (0.187) of the NOK’s monthly fluctuations, compared with 12.6% for CAD. The historical connection was therefore closer for the krone in this analysis.
This is different from the earlier CRB chart, as the scatter plot compares the NOK with Brent over 12 years, while the rolling correlation chart compares it with a basket of commodities over three years at a time.
Norway also shows how different forces can pull a currency in opposite directions. Norges Bank said higher oil and gas prices helped strengthen the krone after June. However, interest rates abroad rose more than Norwegian rates, reducing Norway’s appeal to investors by comparison. ⁽²⁾
Australia: Look at What It Exports
Australia’s government says the Aussie’s 2026 gain came mainly from the interest rate gap, as RBA hikes widened the difference with the US. The RBA lifted its cash rate to 4.60% on September 29, its fourth increase this year. Commodities gave mixed signals.
For Australia, iron ore, coal and LNG are important exports. Iron ore alone makes up almost a third of the RBA’s commodity price index, which tracks Australia’s main commodity exports.
These prices do not always move together. The September Resources and Energy Quarterly shows the commodity price index fell 8.1% in Australian dollar terms in Q3, as weaker gold and iron ore outweighed stronger energy prices. ⁽³⁾
Other factors also influence AUD. China’s economy grew 4.5% year on year in the third quarter, beating expectations. China is Australia’s biggest trading partner, so its economic performance matters for demand for Australian exports such as iron ore and copper. ⁽⁴⁾
Barclays analysts also pointed to AI-related demand as a source of support for Australia’s commodities. They interpreted the RBA’s meeting minutes as showing greater willingness to raise rates than the governor’s initial comments suggested. ⁽⁵⁾
A Weak Correlation Is Not a Dead Link
Research shows why the time frame matters. A research paper by Ferraro, Rogoff and Rossi found a clearer connection between oil and the CAD in daily data than in monthly or quarterly data. A weak relationship can exist with short-term reactions to commodity news.
The choice of commodity matters too. CRB combines oil, metals and agricultural products, but its mix differs from what Canada, Norway and Australia export. A weak connection with the index does not tell us whether a currency has stopped responding to its country’s main exports.
How closely these currencies follow commodities depends on the country’s export mix, the time frame and the returns investors can earn elsewhere. Higher export earnings can help an economy without being enough to lift its currency.